BCG Matrix (1)
BCG Matrix, the Product Portfolio Matrix of the Boston Consulting Group, a simple yet useful tool for marketing budgets can help a firm to make complex decisions very easily.

BCG Matrix (1)
E N D
Presentation Transcript
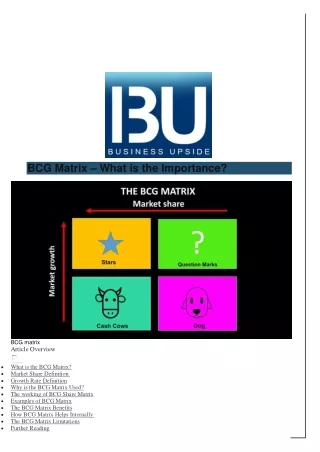
BCG Matrix – What is the Importance? BCG matrix Article Overview What is the BCG Matrix? Market Share Definition Growth Rate Definition Why is the BCG Matrix Used? The working of BCG Share Matrix Examples of BCG Matrix The BCG Matrix Benefits How BCG Matrix Helps Internally The BCG Matrix Limitations Further Reading
People in the corporate world are very much aware of what the BCG matrix is. When with a group of people, when someone mentions about BCG matrix, you tend to think about what is it this term they are discussing about. Through this content, you will have all your questions answered about the BCG matrix. What is the BCG Matrix? The Product portfolio matrix of the famous consulting firm, Boston Consulting Group is the BCG matrix. It is designed in a way that helps the users to create a long-term strategic plan, help a business grow by reviewing its product portfolio and further decide where to invest, and even decided on whether to develop or discontinue a product. BCG matrix is also known as Share Matrix or Growth matrix. To understand how BCG Matrix works and what are the key components associated with it, first, you need to have a clear idea regarding market share and growth rate. Market Share Definition Market share is the percentage of a market that a company owns. Market share can be calculated by dividing the number of units sold by all units sold in the market. Market shares are often calculated for individual products, but they can also be calculated for an entire industry. The importance of market share in the business is that it helps to measure the number of customers, money, and products that a company has. Market share also helps to measure the percentage of the total market for a company’s products or services. Market share is important for companies because it can help them make decisions about what they should do with their business. For example, if a company sees that they are losing market share, then they may need to change their product or service to get more customers. Growth Rate Definition The growth rate is the percentage of change in a quantity over a given period. It is usually measured relative to the initial quantity. The growth rate is used to measure how fast something is growing and how much it has grown over a period of time. This can be done by measuring the percentage of change in an amount, or by measuring the ratio of two quantities. In business’s growth rate refers to the profit growth rate. Why is the BCG Matrix Used? In the year 1968, Bruce Henderson, who is the founder of Boston Consulting Group created the BCG matrix of growth-share. This matrix was published in Perspective, which was a proactive and short essay on BCG. It is a framework of portfolio management. With the help of the matrix, businesses can decide which business out of all, should they prioritize the most.
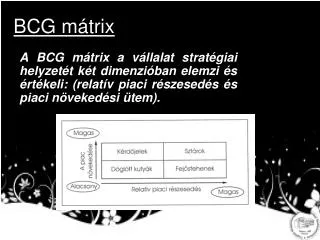
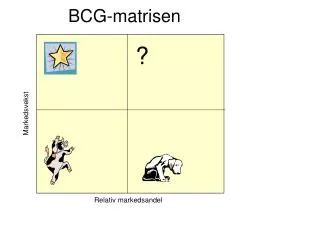
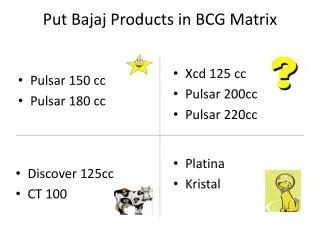
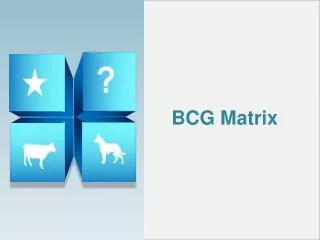
Based on the analysis of relative market share and growth of the market, the BCG matrix, or the Boston Consulting Group matrix can be divided into four different quadrants. These 4-quadrant as an individual has a distinctive symbol that signifies a certain level of profitability. The four symbols are cash cows, stars, question marks, and dogs. It is through these categorizations, an executive decides on which resources should they focus and which capital can be more profitable, and what are the areas where the losses could be cut. There are many BCG matrix template which can be found online. The commonly used template includes a BCG matrix star, BCG matrix cash cow, BCG matrix dog, and BCG matrix question mark. The working of BCG Share Matrix “Sustainable superior returns are the result of market leadership”. In The End, the market leader achieves a self-reinforcing cost advantage which is self-reinforcing and difficult for the competitors to replicate. This was the logic behind the creation of the BCG Matrix. Market attractiveness and the firms’ competitiveness are the two factors of the matrix that should be considered when deciding on what to invest in. The four quadrants represent a certain combination of market growth and relative market share: 1.High share but Low Growth:These “cash cows” should be milked by the firm for the reinvestment of cash. It can be understood that a cash cow means products that have high market share but low market growth. 2.High share and High Growth:“stars” are that quadrant in which the firms should invest much more than other quadrants because the future potentials are high for these. Star refers to products that have both high market growth and low market share.
You can read the full content: https://businessupside.com/2021/01/12/bcg-matrix-what-is-the- importance/ •••••••••••••••••••••••••• BusinessUpside Email ID:support@businessupside. comPhoneNo.:+1-425-605- 0775 Visit Us:https://www.businessupside.co m/ StayConnectedVia: https://www.facebook.com/businessupside https://www.youtube.com/channel/UCuSkeS5oU- B2tRIBDYntmaw https://twitter.com/BusinessUpside1