Download
1 / 6
70 likes | 287 Views
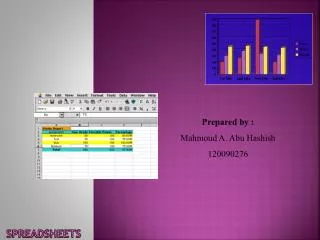
Spreadsheets. Computer Based Spreadsheets. A computer Spreadsheets is a program that can organise data into columns and rows. Spreadsheets are useful when doing complicated calculations and handling large amounts of data.

E N D
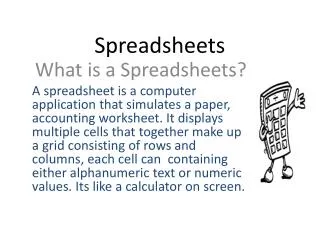
Computer Based Spreadsheets • A computer Spreadsheets is a program that can organise data into columns and rows. Spreadsheets are useful when doing complicated calculations and handling large amounts of data. • Data can be sorted and filtered so you are able to find the information you need quickly. Spreadsheets are used to sort a variety of data and information.
What Spreadsheets Can Do • Stores data (e.g. sale figures, customer details ect…) • Organise data (e.g. sort prices, organise events ect…) • Calculate data (e.g. item prices, staff wages ect…) • And much more…. Spreadsheets are like simple databases.
The Users Of Spreadsheets Organisations like… • Schools/College (e.g. attendance/EMA…) • Government (e.g. expenses, how much they take off people D: “TAX” …) • Shops (e.g. sales…) • Airlines (e.g. flights…) • Couriers (Delivery Companies) And lots more…
Solving Complex Problems Computer spreadsheets have many inbuilt calculation functions to make it easy to do complex calculations. you are able to add up larges amount of data to find the total income for a company. You can also use the VLOOKUP feature to automatically bring in information from another table.
Analysing Data By using spreadsheets to input data. Charts can be generated from that date which can display patterns of interest and analyse peoples needs. Spreadsheets can be used to forecast future profit and loss by looking at trends from the data in the spread Sheet (data mining).