Download
1 / 29
310 likes | 448 Views
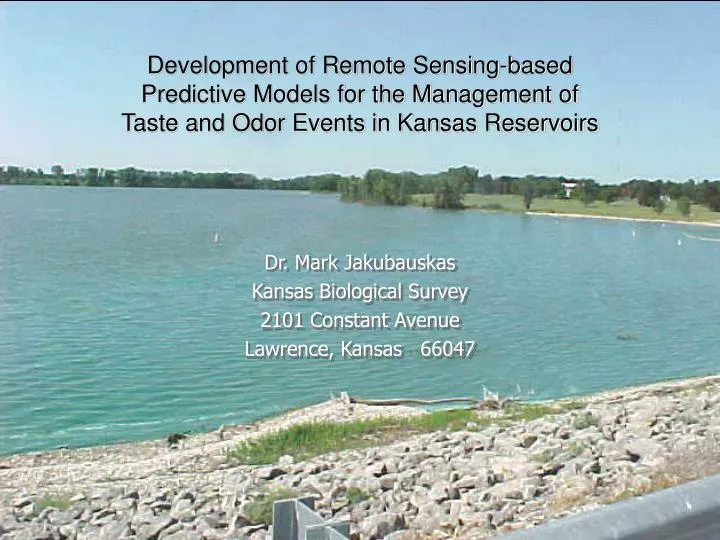
Development of Remote Sensing-based Predictive Models for the Management of Taste and Odor Events in Kansas Reservoirs. Dr. Mark Jakubauskas Kansas Biological Survey 2101 Constant Avenue Lawrence, Kansas 66047.

E N D
Development of Remote Sensing-based Predictive Models for the Management of Taste and Odor Events in Kansas Reservoirs Dr. Mark Jakubauskas Kansas Biological Survey 2101 Constant Avenue Lawrence, Kansas 66047
Development of Remote Sensing-based Predictive Models for the Management of Taste and Odor Events in Kansas Reservoirs • Project Tasks: • A remote sensing-based predictive model providing an advance warning of potential drinking water taste and odor problems. • Remote sensing-based seasonal and year-to-year reservoir condition maps showing sediment plumes and algae bloom patterns within large reservoirs.
Work Item: Develop Advance Warning Model • A predictive model providing an advance warning of potential drinking water taste and odor problems will be developed. • This model will use remotely sensed and other data to develop predictive relationships between surrogates of watershed landscape condition (Normalized Difference Vegetation Index, Vegetation Phenological Metrics), reservoir condition, and reported taste and odor events. • Reservoirs for which the most complete and extensive data sets are available will be selected for this analysis.
Alternate approaches: Land surface state or condition Landsat satellite imagery Clinton Lake watershed, 2002 March 21 July 24 Land cover and use, as traditionally defined, have not changed during the course of the year. Land state or condition, however, changes dramatically. September 26
Quantifying vegetation condition – The Normalized Difference Vegetation Index (NDVI)
Corn phenology as measured by NDVI (April 30-Sept. 24) 6/15 6/2 5/26 Bare soil to near-complete canopy in 20 days
Seasonal changes in NDVI March 1999 Late May, 1999 July 1999 Early October, 1999
Remote sensing of watershed conditions:Clinton Lake watershed, 1997 and 1998 Mid-July 1997: Springtime rainfall – 10.5 in. Vegetation in a watershed is highly sensitive to year-to-year variations in temperature and rainfall, changes that can predict water quality impairment. Topeka Mid-July 1998: Springtime rainfall = 3.9 in. Topeka
Satellite NDVI is responsive to climate variations Average growing season NDVI as a function of precipitation for a fifteen-month precipitation period (current growing season plus the seven preceding months).
Watershed NDVI and water quality relationships Predicting potential total phosphorus using satellite-derived vegetation indices
E. Develop Alternative Monitoring Methods • Many reservoirs exhibit relatively rapid changes in water quality conditions, sediment plumes and algae blooms that are difficult and expensive to detect using traditional sampling techniques. • Multitemporal MODIS satellite imagery will be used to develop seasonal and year-to-year reservoir condition maps showing sediment plumes and algae bloom patterns within large reservoirs. • As a prototype, Kansas’ 10 largest reservoirs providing a significant source of drinking water will be mapped.
Examples of satellite imagery of reservoir algae blooms Cheney Reservoir, June-July, 2003 1 mile Red areas on this Landsat Thematic Mapper image indicates high chlorophyll (blue-green algae) concentrations in the water.
Examples of satellite imagery of reservoir algae blooms “Following a three-week ordeal with anabaena algae in the Marion Reservoir, the water plants in Hillsboro and Marian were able to restore service in early July.” Kansas Municipal Utilities Newsletter, August 2003 April 21, 2003 July 10, 2003 Red areas on these Landsat Thematic Mapper images indicate high chlorophyll (blue-green algae) concentrations in the water.
Low turbidity High turbidity Identifying spatial and temporal patterns:Similarities and differences in turbidity among reservoirs within the same region.
Reservoir Bathymetry – some brief notes • In May 2006, the Kansas Biological Survey acquired a Biosonics DT-X digital acoustic echosounding system. • The system, sampling methodologies, and data processing approaches are currently being tested. • Lone Star, Olathe, and Carbondale Lakes have been surveyed under the testing phase (Gardner Lake scheduled for July 26, 2006)
Acoustic Remote Sensing for Reservoir Studies Depth = ½ (Speed of sound in water x time) “Echogram” Intensity and timing of the signal received back by transducer is a function of depth, intervening medium (water), and the characteristics of the bottom sediments.
Carbondale Lake – KBS bathymetry overlaid on pre-impoundment topographic contour map
Development of Remote Sensing-based Predictive Models for the Management of Taste and Odor Events in Kansas Reservoirs Dr. Mark Jakubauskas Kansas Biological Survey 2101 Constant Avenue Lawrence, Kansas 66047