Recurrent Inhibition of VL H-Reflex in Soleus Responses: Effects of PTN Stimulation
10 likes | 97 Views
This study analyzes the inhibition of H-reflex in the soleus muscle in response to PTN stimulation, adjusted based on the M response in the FDB muscle for 4 healthy subjects at rest. Grouped data shows varying levels of inhibition based on the ISI between PTN and FN stimulations, M response intensity, and PTN stimulation intensity. The study also includes the size of M response and H-reflex in soleus plotted against PTN stimulation intensity, providing valuable insights into recurrent inhibition dynamics after BoNT-A. 8 Relevant

Recurrent Inhibition of VL H-Reflex in Soleus Responses: Effects of PTN Stimulation
E N D
Presentation Transcript
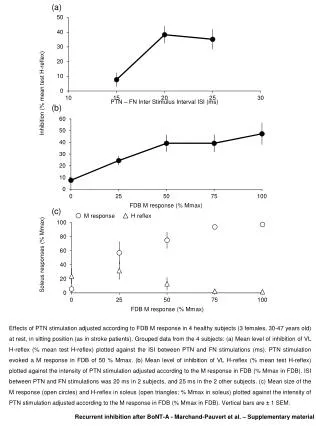
(a) Inhibition (% mean test H-reflex) (b) (c) Soleusresponses (% Mmax) Effects of PTN stimulation adjusted according to FDB M response in 4 healthy subjects (3 females, 30-47 years old) at rest, in sitting position (as in stroke patients). Grouped data from the 4 subjects: (a) Mean level of inhibition of VL H-reflex (% mean test H-reflex) plotted against the ISI between PTN and FN stimulations (ms). PTN stimulation evoked a M response in FDB of 50 % Mmax. (b) Mean level of inhibition of VL H-reflex (% mean test H-reflex) plotted against the intensity of PTN stimulation adjusted according to the M response in FDB (% Mmax in FDB). ISI between PTN and FN stimulations was 20 ms in 2 subjects, and 25 ms in the 2 other subjects. (c) Mean size of the M response (open circles) and H-reflex in soleus (open triangles; % Mmax in soleus) plotted against the intensity of PTN stimulation adjusted according to the M response in FDB (% Mmax in FDB). Vertical bars are ± 1 SEM. M response H reflex Recurrent inhibition after BoNT-A - Marchand-Pauvert et al. – Supplementary material