Download
1 / 15
150 likes | 168 Views
Explore the fascinating density columns in the Arctic's Bering Sea, where phytoplankton thrive in the freshwater layer, driving the ecosystem's vitality. Learn about the crucial role phytoplankton play as a food source for marine life, the significance of sunlight in their growth, and the delicate balance of the Arctic ecosystem.

E N D
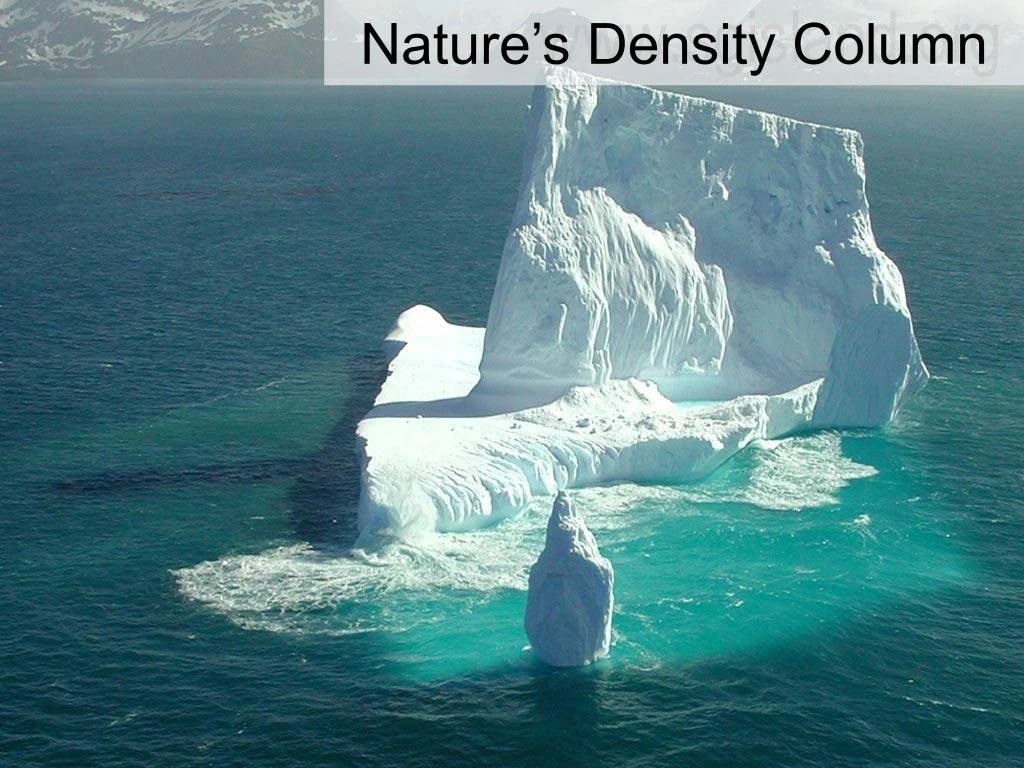
Nature creates its own density columnExample:The Bering Sea • As you discovered in your experiment, when ice melts it forms a less dense layer of freshwater on top of the more dense layer of saltwater • These types of density columns exist in nature, especially in areas like the Arctic (Bering Sea)
Can you think of other areas where freshwater and saltwater meet?
Density columns are extremely important in the Arctic • The two layers of different density water have a hard time mixing together- it usually takes a storm or lots of wind to mix the two layers. • Phytoplankton (microscopic plants) live in the ice. When the ice melts, the phytoplankton are released into the water. • The phytoplankton mostly stay in the freshwater layer because it cannot mix easily with the more dense, salty water below it.
Why is this so important? • The phytoplankton depend on sunlight to create their food- using chlorophyll • Sunlight can only go so deep into the water before it runs out. • By staying in the freshwater layer, the phytoplankton get more light than they would if they could travel to the saltwater layer. ice fresh melt water saltwater
More sunlight means more food for the phytoplankton. • Like all plants, the sun helps them to grow and multiply their numbers very quickly. When they do this, it is called a “bloom” • Phytoplankton are a very important food resource for all other organisms in the water. • They get eaten by microscopic animals (zooplankton) • They are also eaten by organisms that live on the bottom of the ocean (benthic organisms) • Zooplankton and benthic organisms are then eaten by large animals such as fish, birds, walrus, whales, etc • Without phytoplankton, most life in the water would not exist.
BELOW: The phytoplankton (viewed with a microscope) found in the ice and water. Millions and millions of these tiny cells in long chains make up a phytoplankton bloom ABOVE: Sea ice with phytoplankton living inside it (see all the brown?)
Definitions • Chlorophyll: What plants use to create their food, using energy from the sun. • Oceanographers measure the amount of chlorophyll in the water, which gives them a good idea of how much phytoplankton are in the water. • Salinity: A word used to describe how much salt is in the water. • CTD: An instrument that collects water from different depths in the water, as well as measures things like salinity, temperature, depth, oxygen, and chlorophyll in the water. …In the next few slides, we will look at the salinity, density and chlorophyll data collected on this year’s Bering Sea cruise…
The CTD is used to collect water samples at different depths using these bottles which can be triggered to close at any depth from the ship. This part of the CTD measures salinity, temperature, oxygen, chlorophyll and depth in the water. The data is sent to a computer on the ship where a graph is created. The scientists on the ship look at the graph to decide where they want to take their samples.
Station 5- Ice covered station What do you notice about the salinity, density and chlorophyll at this station?
What does the density look like where the most chlorophyll occurs? What causes the low density? Station 133: Located at the edge of the ice
The dark purple line shows where the ice edge is. What do you notice about the amount of chlorophyll (phytoplankton) that are in the water at the ice edge?
A view of the Bering Sea from a satellite. All those green swirls are phytoplankton blooms- so many that they can be seen from SPACE!! All that phytoplankton gets eaten by larger animals- this is why the Bering Sea (and other Arctic regions) is SO important!!!