Download

1 / 12
0 likes | 14 Views
Consumer lenders face stiff competition, and staying ahead requires more than just approving loans and collecting payments. It demands a thorough understanding of key performance indicators (KPIs) that can drive strategic decision-making and ensure sustainable growth.

E N D
Key Consumer Lending KPIs Every Lender Should Track www.brytsoftware.com
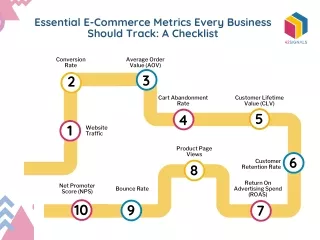
Consumer lenders face stiff competition, and staying ahead requires more than just approving loans and collecting payments. It demands a thorough understanding of key performance indicators (KPIs) that can drive strategic decision-making and ensure sustainable growth. This infographic presents the most critical KPIs that every consumer lender should monitor.
01 DELINQUENCY RATE (DR) DR measures the percentage of loans in a lender's portfolio that are past due or overdue. A higher delinquency rate indicates a higher risk of loan defaults and potential credit losses.
02 LOAN DEFAULT RATE Loan default rate represents the percentage of loans in a lender's portfolio that have defaulted or are unlikely to be repaid A higher default rate signifies increased credit risk and potential losses for the lender.
03 LOAN PORTFOLIO YIELD (LPY) LPY represents the income generated from the lender's loan portfolio, reflecting the effectiveness of the lender's loan pricing strategies. A higher loan portfolio yield indicates higher profitability for the lender but may also suggest higher risk if interest rates are excessively high.
04 NET INTEREST MARGIN (NIM) NIM is the difference between the interest income generated by a lender's interest-earning assets and the interest expense paid on its interest-bearing liabilities (deposits and borrowings). A high NIM suggests that the lender's portfolio generates profit, which is crucial for revenue.
05 COST OF FUNDS (CoF) CoF represents the interest expense a lender pays to acquire funds for their funding activities, such as deposits or other borrowings. Lower CoF indicates more cost-effective funding, improving overall profitability.
06 LOAN-TO-DEPOSIT RATIO (LDR) LDR measures the relation between a lender's total loans and their total deposits. A higher ratio may indicate that the lender is maximizing its lending capacity but could also suggest increased liquidity risk if it is excessively high.
07 COLLECTION EFFECTIVENESS INDEX (CEI) CEI measures the efficiency of a lender's collection efforts. A higher CEI indicates more effective collection practices, critical for maintaining cash flow and minimizing losses.
08 DAYS SALES OUTSTANDING (DSO) DSO measures the average number of days it takes for a lender to collect payment after a loan is issued A lower DSO suggests more efficient collections and better cash flow management.
09 PROFIT PER ACCOUNT (PPA) PPA measures the average profit generated by each customer or loan account within the collections team. High PPA suggests that your loan portfolio can generate profit even from delinquent accounts.
www.brytsoftware.com An Automated Loan Management Solution That Monitors your Loans For You.