Download
1 / 2
20 likes | 101 Views
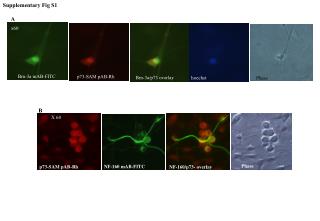
This study presents a detailed analysis of Brn-3a and p73 interaction in neural cells using immunofluorescence at 60x magnification. The overlay images show the colocalization of Brn-3a and p73, alongside DNA content and cell number quantification. The data provides insights into cellular processes involving Brn-3a and p73 in neural cells.

E N D
Supplementary Fig S1 x60 Brn-3a mAB-FITC p73-SAM pAB-Rh Brn-3a/p73 overlay hoechst Phase X 60 Phase NF-160 mAB-FITC p73-SAM pAB-Rh NF-160/p73- overlay A B
A Supplementary Fig S2 Cell number Cell number 70 (-) Brn-3a ** 60 (+) Brn-3a DNA content DNA content * 50 40 % of cells in G1 phase Cell number Cell number 30 20 DNA content DNA content 10 0 Cell number p73α p73β Cell number Vector Brn-3a ΔNp73 p73βΔOD DNA content DNA content Cell number Cell number DNA content DNA content Cell number Cell number DNA content DNA content B