Download
1 / 17
170 likes | 322 Views
In the name Of Allah, The most Gracious, The Most Merciful. Kerman University of Medical Sciences. Basic concepts of Life expectancy. AliAkbar Haghdoost, epidemiologist. The impact of our advancement on human life.

E N D
In the name Of Allah, The most Gracious, The Most Merciful Kerman University of Medical Sciences Basic concepts of Life expectancy AliAkbar Haghdoost, epidemiologist
The impact of our advancement on human life • People are now living longer. This is a gift of science, medicine and technology with the discoveries of many treatments for life threatening diseases all contributing to us staying alive longer.
Summary impact indicators of health • We would like to have summary indicator to • Show the general level of health • To assess the impact of our programs • To compare populations • To ……. • What are the main characteristics of a general health indicator?
What is your idea • Can we measure the age of people as an indicator of health? • What are the advantage and disadvantage of the following indicators? • The mean of age in a population? • The proportion of elderly people in a population?
Disadvantages of mean of age and the frequency of aged population • Survival bias: is the logical error of concentrating on the people or things that "survived" some process and ignoring those that didn't. Survivorship bias can lead to overly optimistic beliefs because failures are ignored • The age pyramid of population changes the mean of age substantially • Birth rate/migration in recent decades has considerable effect on the frequency of aged population
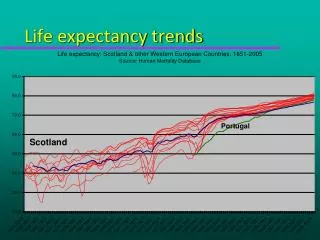
Life expectancy • Life expectancy (LE) by definition is the expected number of years of life remaining at a given age; in other words it shows how long we expect people to live in different age-groups.
In a cohort of 1000 people, if all die at age 80 LE is 80 years Total number of life=80*1000=80,000 The average of expected life=80,000/1000=80
In a cohort of 1000 people, if all die at age 80 except 100 who die at birth LE is 72 years Total number of life=80*900=72,000 The average of expected life=72,000/1000=72
In a cohort of 1000 people, if all die at age 80 except 100 who die at 50 LE is 77 years Total number of life=50*1000+900*30=77,000 The average of expected life=77,000/1000=77
What is life expectancy based on this table? LE is 50.1 years Total number of life=1*1000+29*900+20*800+20*300+10*100=50,100 The average of expected life=50,100/1000=50.1
Limitations • Do you think in reality, a new baby will be alive equal to the current LE at birth? Think about cross-sectional and longitudinal approaches?
Limitations • How can we assess the level of inequality using LE as a summary indicator of the general health?
Limitations • LE shows the impact of the age distribution of deaths only • How we can take into account the impact of morbidity as well?
What is life expectancy based on this table? Health Adjusted Life Expectancy=?
What are the extra applications of LE? • Life expectancy of education in Iran • Male=12 years • Females=11.3 years
What is the best way to measure the age of menopause? Age at natural menopause in Iran? The number of 8194 women aged between 30 and 65+ the pattern of age at natural menopause has been described using a cumulative distribution. RESULTS: The mean age at menopause in total population was 50.4 years (S.D.=4.3).