Life Expectancy
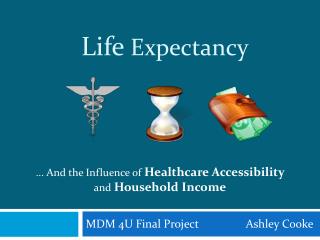
Life Expectancy. ... And the Influence of Healthcare Accessibility and Household Income. MDM 4U Final Project Ashley Cooke. Introduction. Life Expectancy vs. Healthcare Accessibility Life Expectancy vs. Median Household Income 51 States (including District of Columbia).

Life Expectancy
E N D
Presentation Transcript
Life Expectancy ... And the Influence of Healthcare Accessibility and Household Income MDM 4U Final Project Ashley Cooke
Introduction • Life Expectancy vs. Healthcare Accessibility • Life Expectancy vs. Median Household Income • 51 States (including District of Columbia)
Variable 1: Life Expectancy • Our society is fascinated with longevity
Variable 2: Healthcare Accessibility Healthcare is... • Important to achieve a long, healthy life
Variable 2: Healthcare Accessibility Healthcare is... • A personal interest • Career
Variable 2: Healthcare Accessibility Healthcare is... • Local • Hamilton Health Sciences • St. Joseph’s Healthcare Hamilton • Medical Research
Variable 2: Healthcare Accessibility Healthcare is... • In the news • American Health Care Reform • Ontario Health Care changes • Restructuring visible in Hamilton
Variable 3: Household Income Household Income is... • a victim of the recession • Local Hamilton job losses • Unemployment Rate • Median Household Income
Variable 3: Household Income Household Income is... • A potential factor in achieving longevity
Variable Definitons • Average Life Expectancy (at birth, in Years) • Healthcare Accessibility • Estimated Underserved Population [living in a Primary Care Health Professional Shortage Area] as % of State Population • Median Household Income (US Dollars)
One-Variable Analysis Histograms Life Expectancy % Estimated Underserved Population Median Household Income
Scatter Plot Hypothesis Life Expectancy vs. % Estimated Underserved Population Life Expectancy vs. Median Household Income
Hypothesis Life Expectancy vs. % Estimated Underserved Population • Moderate, Negative correlation
Hypothesis Life Expectancy vs. % Estimated Underserved Population • % Underserved Population increases, Life Expectancy decreases
Hypothesis Life Expectancy vs. % Estimated Underserved Population • + % Population Underserved • - Access to Healthcare • - Life Expectancy
Hypothesis Life Expectancy vs. Median Household Income • Moderate, Positive correlation
Hypothesis Life Expectancy vs. Median Household Income • Median Household Income increases, Life Expectancy increases
Hypothesis Life Expectancy vs. Median Household Income • + Income • + Spent on Healthy Lifestyle • + Life Expectancy
Two Variable Analysis Scatter Plots Conclusions
Hawaii, 81.5 years y=-0.0927 x + 79.483 r2= 0.1599 r= -0.399887247 New Jersey, 0.3% Mississippi, 74.8 years, 31.5%
Conclusions Hypothesis • Moderate, Negative correlation Conclusion “r” value: -0.4
Conclusions • % Underserved Population increases, Life Expectancy decreases
New Jersey, $61 359, 79.7 yrs D.C., $46 474, 75.6 yrs y= 0.0001x + 72.123 r2= 0.3764 r= 0.61348 Mississippi, West Virginia- $31 504, 75.2 yrs
Conclusions Hypothesis • Moderate, Positive Correlation Conclusion “r” value: +0.6
Conclusions • Median Household Income increases, Life Expectancy increases
Conclusions • Both Hypotheses correct • Both relationships had significant correlations • Median Household Income had a stronger correlation with Life Expectancy • Surprising • Encompasses more lifestyle aspects
Sources of Error Sample Error Other Sources of Error
Sources of Error • Reliable Sources • Life Expectancy • National Center for Health Statistics • US Census Bureau population data • calculations from the American Human Development Index.
Sources of Error • Reliable Sources • % Estimated Underserved Population • Health Resources and Services Administration (HRSA), • Population data from U.S. Census Bureau • multiply the number of primary care physicians are by target population-to-practitioner ratio (2,000:1), subtracting from the total HPSA population • Doesn’t account for private practices
Sources of Error • Reliable Sources • Median Household Income • American Community Survey (Sample)
Sources of Error • Sample Bias • Collection year differences • Life Expectancy (2007) • % Estimated Underserved Population (February 2012) • Median Household Income(2004)
Sources of Error • Manual Data Entry into Excel
Sources of Error • No substantial outliers
Sources of Error • One possible outlier District of Columbia Income: $46 474 Life Expectancy: 75.6 yrs
Data Sources Variable Definitions & Sources
Dependent Variable: Life Expectancy Variable Definition Life Expectancy data in this report was given by “Life Expectancy at Birth” in years for each state. Source(s) Data was found in the “Life Expectancy at Birth (in years), 2007” table on statehealthfacts.org: Statehealthfacts.org lists their sources as “Data from The Centers for Disease Control and Prevention, National Center for Health Statistics mortality data and US Census Bureau population data, 2007; calculations from the American Human Development Index. Available at: http://www.measureofamerica.org/maps/.”
Independent Variable: Healthcare Accessibility Variable Definition Healthcare Accessibility in this report was represented by the “Estimated Underserved Population [living in a Primary Care Health Professional Shortage Area] as % of State Population”, where a Primary Care Health Professional Shortage Area (HPSA) is defined as: “For a geographic region to be deemed a primary care HPSA population to full-time equivalent primary care provider ratio must exceed 3,500:1 (3,000:1 in areas with unusually high need). For a population group to be deemed a primary care HPSA there must exist barriers to accessing care, that may be socioeconomic, cultural or linguistic, or that may result from a dearth of local providers who are willing to accept patients from such backgrounds or who refuse to accept Medicaid reimbursement. Native American Indian tribes are universally recognized as population group HPSAs. For a health care facility to be deemed a primary care HPSA, it must be a public or non-profit health care delivery site and must have inadequate resources to fulfill the primary care needs of the area or population group.” Also, “Estimated Underserved Population is computed by multiplying the number of primary care physicians in the HPSA by the target population-to-practitioner ratio (2,000:1), and subtracting this figure from the total HPSA population” Source(s) Data was found in the “Primary Care Health Professional Shortage Areas (HPSAs), 2012” table on statehealthfacts.org: Statehealthfacts.org lists their sources as, “Designated Health Professional Shortage Areas (HPSA) Statistics, Health Resources and Services Administration (HRSA), February 2012” and “Percentages calculated using 2010 population data from U.S. Census Bureau; available at http://2010.census.gov/2010census/data/.”
Independent Variable: Median Household Income Variable Definition Median Household Income in this report was defined by “Median Household Income (In 2004 inflation-adjusted Dollars), 2004”. Source(s) Data collected from “Median Household Income (most recent) by state” table on statemaster.com: Statemaster.com lists their source as “American Community Survey 2004”. This is a sample data set.