ESPC Net-Zero Challenge
ESPC Net-Zero Challenge. Overview. President’s Performance Contract Challenge Background on GSA Energy Mandates American Recovery and Reinvestment Act Deep Retrofits GSA ESPC Net Zero Renovation Challenge What’s Next?. Progress Targets & Milestone Targets.

ESPC Net-Zero Challenge
E N D
Presentation Transcript
Overview • President’s Performance Contract Challenge • Background on GSA • Energy Mandates • American Recovery and Reinvestment Act • Deep Retrofits • GSA ESPC Net Zero Renovation Challenge • What’s Next?
Progress Targets & Milestone Targets • To track Agency progress, CEQ/FEMP has developed Milestone Targets and Progress Targets • Milestone Targets are major project development milestones. If an agency fails to get 100% of its total project investment by the milestone target date, a “ ” is earned on its Progress Report. • Progress Targets track agency progress: if an agency’s project investment amount is not 25, 50, or 75 percent of its Milestone Target by the prescribed dates, it earns a “ ”.
Explanation of Progress Report As of May 15, 2012, only one Milestone has been reached. The next is due July 15, 2012 Milestone Targets occur when 100% of committed project investment is at a milestone stage by the due date An agency will earn a red dot if they miss a Milestone Target Progress Targets measure total committed in progressively higher 25%, 50%, and 75% levels as the due date approaches Project Development Milestones A grey dot indicates no Milestone or Progress Targets are due. An agency will earn a yellow dot if they miss a Progress Target This chart shows the distribution of the agency’s current project investment among project development stages as reported in OMB Max. “No start/no data” is the amount of project investment either not started or lacking data. This chart breaks down total project investment by contract vehicle used. The “Investment Gap” is the difference between agency commitment and total current project investment.
Resources • FEMP • GSA • Resources available to each of your sites: FFS, PFs, GFO contracting mentors, contracting support from DLA, Huntsville, private contractors. Extensive training and technical information on the web. • An extensive ESCO network .
Program Options: A new option for many small sites • Most large and medium sites will be well served through the standard ESPC and UESC offerings. • Small sites should explore FEMP’s newest program option: ESPC ENABLE. • Pilot program designed to make projects at small sites cost effective for agencies and ESCOs. • Projects will be executed through GSA Schedule 84, using a new set of automated and standardized tools and contract templates. • FEMP has identified five agencies to partner with to establish agency specific approaches to implementing ESPC ENABLE projects.
Near Term Deliverables • May 15: $ Projects ≥ $ Commitment? • July 15: Acquisition Plans Complete;Projects’ Timelines Established • August 15: Notices of Opportunities Issued • Federal Environmental Executive will follow up with agencies not meeting these milestones to identify strategies /actions to meet the milestones.
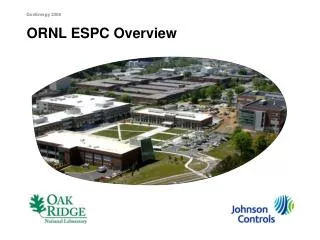
Background on GSA GSA consists of: Public Buildings Service (PBS) Federal Acquisition Service (FAS) Office of Governmentwide Policy (OGP) other staff offices 9,624 buildings in 11 regions 1,530 owned and 8,094 leased (2010) 370.2 million rentable square feet, or 34.4 million square meters Landlord for 400 federal agencies, bureaus and commissions with space for over 1,000,000 tenants
GSA Energy Profile • Currently represents 9.3% of civilian agency energy usage, 3.7% of Federal total • Has achieved ~16% in energy reduction from 2003 baseline (source: FY2010 OMB Scorecard on Sustainability/Energy)
GSA Office of Federal High Performance Green Buildings Players Influences Research Adoption Relationships Roles
Sustainability & Regulations Laws ▪ National Environmental Policy Act, 1969 ▪ Clean Air Act, 1970; amended 1990 ▪ Energy Policy and Conservation Act, 1975 ▪ Resource Conservation & Recovery Act, 1976; amended 1994 ▪ National Energy Conservation Policy Act, 1978 ▪ Energy Policy Acts, 1992, 2005 ▪ Energy Independence and Security Act, 2007 Executive Orders ▪ 13101 Greening the Government through Waste Prevention, Recycling & Federal Acquisition ▪ 13123 Greening the Government through Efficient Energy Management ▪ 13134 Developing & Promoting Biobased Products and BioEnergy ▪ 13148 Greening the Government through Leadership in Environmental Management ▪ 13327 Federal Real Property Asset Management ▪ 13423 Strengthening Federal Environmental, Energy, and Transportation Management ▪ 13514 Federal Leadership in Environmental, Energy, and Economic Performance
Recovery Act Portfolio Energy Use Reduction • The combined Recovery Act portfolio of Major Modernization and Limited Scope projects will be 30% more energy efficient than the CBECS2 national average. • Recovery Act projects are expected to reduce energy consumption by 18% across 447 buildings (for Major Modernization, Limited Scope, and Small Projects). • Average annual cost savings is an estimated $44.4M per year. 2 Commercial Building Energy Consumption Survey (CBECS) national average energy intensity = 90 kBtu/sq. ft PBS 2003 and 2009 baseline energy intensity on Recovery Act projects from GSA's Energy Usage Analysis System (EUAS)
Recovery Act Deep Retrofits • A deep retrofit is a modernization that is anticipated to achieve an energy reduction of at least 50%. • Of the 45 Recovery Act modernization projects, six are anticipated to reduce overall energy consumption by at least 50%. • Five of the deep retrofits are projected to reduce overall energy consumption from 53%-68%. • Five of the deep retrofit modernizations are utilizing renewable energy technologies to reduce overall energy consumption. • An additional twelve limited scope and modernization projects anticipate achieving an energy reduction between 40% and 50%. • All Recovery Act buildings undergoing Major Modernization projects are expected to achieve enough gains in energy efficiency to meet EISA 2007 requirements.
Recovery Act Case Study • Net-zero energy target • Platinum LEED rating goal • Historic Building • 123 kW PV array to produce 170,000 kWh a year (greater than 50% of the building’s historical annual electricity use) • Ground source heat pumps • ECMs: lighting control and monitoring, demand controlled ventilation, plug load management measures, thermally improved building envelope. • Building physics analysis used CO, Grand Junction Wayne N. Aspinall Federal Building & US Courthouse
Approach to Net ZeroRecommended Approach Source: RMI
“Deep Energy” Retrofit • Process Differentiators • Building Owner Involvement • Integrative Design • Advanced Auditing, Modelling, LCCA • Ongoing M&V • Occupant Engagement • Results: • Larger Energy Savings • Improved Project Economics
SAVINGS IN EXCESS GUARANTEED PORTION SERVICE PAYMENTS PAYMENTS TO FINANCING INSTITUTION PAYMENTS TO UTILITY PROVIDERS Energy Savings Performance Contract (ESPC) Zero or positive net impact on existing budgets. PAYMENTS TO UTILITY PROVIDERS BEFORE PERFORMANCE CONTRACT AFTER PERFORMANCE CONTRACT
Timing is Key to Profitable Deep Retrofits • Planned Capital Improvement • Major Occupancy Change • Major System Replacement • Upgrades to Meet Code • Fixing an “Energy Hog”
GSA Use of ESPCs • $440M invested in ESPC since 1999 • Renewed GSA interest and investment in ESPC ($262M in FY10-11) GSA proposes to employ a Net Zero ESPC Challenge as a tool to further accelerate the use of ESPC’s by the GSA regions in addressing energy reduction goals
Background • October 20, 2011 Administrator Johnson’s Announcement: GSA Challenges Private Sector to Reduce Energy Use at Federal Buildings • October 27-28, 2011 ESPC Charrette • December 2, 2012 Presidential Memorandum • $2 billion in performance-based contracts within 24 months • Report planned implementation schedule by 1/31/2012 • Issue NOO in March, 2012
GSA Challenge Goals • Demonstrate best practices for maximizing overall ESPC project energy savings; • Advance progress toward EISA goals; • Accelerate deployment of underutilized and renewable technologies; • Further expose GSA regions to DOE ESPC IDIQ contract process and resulting improvements in ESCO selection; • Identify and understand processes necessary to get to net zero energy; • Identify structural, contractual and technical impediments.
GSA Challenge Framework • Site Selection: GSA selected 30-35 buildings for competition across multiple regions • Award Process: Buildings to be awarded with DOE’s streamlined competition process • Recognition: Projects to be evaluated by a panel of independent experts to identify and recognize exceptional performance in a number of technical categories 1. absolute energy savings of pre-retrofit energy use 2. progress towards Federal Government goals for energy, water, fossil fuel, renewable energy, and sustainability 3. financial and technical creativity 4. ability to extend best practices to other Federal buildings.
ESPC Charrette • Analysis and Integrated Design 2. Project Economics 3. Delivery Process 4. Occupant Behavior 5. M & V
Analysis and Integrated Design • Deep savings may not be cost effective over contract term • Lack of information on existing buildings • Typical ESPC process looks at individual ECMs • High risk to guarantee deep savings
Project Economics • High financing costs • Integration with planned improvement projects • Inclusion of avoided future costs in ESPC including capital and maintenance • Contract duration limits longer payback measures
ESPC Delivery Process Months 1 2 3 4 5 6 7 8 9 10 11 12 12.1 mos. Best-Expedited Schedule 28 days 132 days 15 14 105 days 30 days 45 days • Project planning(28-63 days) • Work w/FFS • Form Acq. Team • Request PF TO-RFP(15-35 days) IGA & Final Proposal(105 – 150 days) Site/Agency Review (30 days) Final Reviews, Negotiations, and Award(45-55 days) • Prelim. Assessment — ESCO selection(132-246 days) • Notice of Opp. • Select ESCO • Evaluate PA • Send NOIA GFO Review(14 days) Longer Schedule 63 days 246 days 35 Project planning PA – ESCO selection TO-RFP IGA & FP 19.5mos. 150 days 30 days 14 55 days IGA & Final Proposal Final nego’s & award GFO Site/Agency Review 13 14 15 16 17 18 19 20 21 22 23 24 Months Source: DOE/FEMP 29
Occupant Behavior • Difficult to quantify energy/cost savings • Limited good examples of “Behavior ECMs” • Hard to incentivize all occupants • ESCOs have no control over occupants
Measurement & Verification • Uncertainty/variability of how building is operated after installation • Cost, level of effort, and complexity for whole building M&V • Consistency across GSA offices, agencies and regions • Improved baseline performance data
Additional Improvement Opportunities • Improve the ESPC award and M&V process • Treat O&M as ECM and have ESCO provide that service • Allow avoided future replacement costs • Share risk • Accept occupant behavior energy use reduction • Support multi-building projects • Improve building energy data base lining • Renegotiate FEMP contract terms
High Priority Solutions • Reduce time to contract award • Redefine eligible savings • Share risk • Combine funding • Multi-building projects, bundling • Consider occupant behavior programs
ESPC Challenge Buildings • 30-35 Buildings • 18 million sqft • 100,000 – 800,000 sqft • $150-250 million potential project size • $7 million annual savings potential
And The Elephant in the Room We Need To Use Less: Square Feet
E X A M P L E: A R R A P R O J E C T Broad Range of Opportunities and Challenges • 1975 Federal Building • Never Upgraded • Plan: • Updating Cutting Edge ‘Green’ • Design • $133 M from Recovery Act • Full Building Modernization • High Aims for Sustainability and Curb Appeal • Construction procurement • underway Portland, OR
T H E E X T R E M E C H A L L E N G E Broad Range of Opportunities and Challenges • Historic 1917 Building • Last Upgraded in 1935 • Plan: • Modernization with Infill • $161 M from Recovery Act, as Phase I • Must Redesign for Energy Goals Washington, D.C.
What’s Really Happening in the Office? Autur and Murmane, 2003
Questions? Kinga Porst kinga.porst@gsa.gov Kevin Kampschroerkevin.kampschroer@gsa.gov Sharon Conger sharon.conger@gsa.gov FEMP: Dr. Timothy Unruh Timothy.Unruh@ee.doe.gov