
Digital Campaigns
E N D
Presentation Transcript
Simplify Name| Job Title | October 2009 Digital Campaigns
? quanto tempo dedichi al tuo ad server
No Time For Strategy Complex Analytics Agency Profitability Cross Channel Measurement Multiple Sources of Data Reporting Trafficking Fatigue Getting Campaigns Live Ad Serving Not User Friendly Too Much Excel Delivery Campaign Performance Publisher Specs Little Time for Optimisation Too much data, not enough time
sforzo lavoro più più tempo meno
Il primo passo è ammettere… Dysfunctional Campaign Process Analytic Complexities Tecnologia non flessibile …che abbiamo un problema
? perchè
Gli adserver attuali sono costruiti su vecchie tecnologie
Fondazionicostruite per il futuro Current ad server platformsare built on decade old technologies
Investitoanni milioni di € Speso 1 00s Intervistato
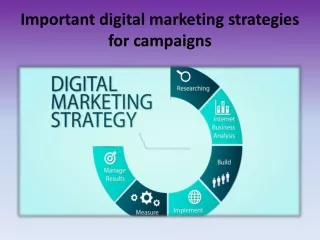
Actionable Analytics Streamlined Ad Serving Open Workflow
Actionable Analytics Extracting meaning out of piles of data
Difficoltà: risultati cross-channel in tempo-reale
Campaign Monitor la finestra sulla campagna • Analizza il comportamento dall’inizio alla fine della campagna in tempo reale • Ottimizza al volo • Monitora il delivery, la performance, il set-up, e altro Dati aggiornati ogni 15 minuti
Difficoltà: ottenere dati cross-channel utilizzabili senza perdere ore in excel
1-Click PowerPoint • Sintesi della campagna in ppt • Contenutopersonalizzabile • Completi di tavole e grafici • Semplicità di esposizione dei dati di branding
21 reports per agenzia 8 reports per creatività 3 reports per sito Permettonoanalisiveloci, in profondità e chiare Nei reports sono inclusi: Delivery Performance by frequency Unique user metrics Engagement Video performance Conversions Path to conversion Cross media integration Report predefiniti
Eyeblaster – Campaign Summary performance totali di campagna
Eyeblaster – Campaign Summary metriche di sovrapposizione reach tra i siti
Eyeblaster – Campaign Summary metrichedisovrapposizione reach traisiti
Eyeblaster – Campaign Summary metriche di sovrapposizione reach tra i siti
Made visual • Rappresentazione grafica dei dati inclusi nei report • Sono presenti anche Benchmarks per Industries Eyeblaster benchmark sample
Custom report builder • Crea il tuo report velocemente • Le tuemetrichepreferite in un unico report. • Gestisci i dati come megliocredi • Tutti i dati di cui hai bisogno da qualsiasi prospettiva. • Una voltacreato il report lo puoiadattare a tutte le campagne • Pronto per essereutilizzato con tabelle pivot. • Apprendi di più dallatua campagna • Alcunicampi e metrichesono solo disponibilinel CRB .
Plug in for excel • Excel add-on scaricabile • Accediai dati della campagna con Excel • Crea un report con le metriche desiderate • Aggiorna solo i dati necessari
Difficulty: Analizza il comportamento del consumatore prima che converta
Report sull’effettivo comportamento Utilizza il Search per informarsi Vede lo standard ad Visita il sito web Acquista o Converte Interagisce con il Rich Media
Analisi del Path to Conversion • Use impact rates to establish benchmarks for publisher optimisation • Identify areas of opportunity or trouble, along the path that might effect overall performance • Use data towards future strategy in ad sequencing or delivery 100% 20% 100% 50% 100%
Ad Serving razionalizzato Set-up e misurazione della campagna più veloce e intelligente
Difficoltà: Passare dal punto A al B velocemente
Cinque Clicks in Uno “ Process Guide RicercaUniversale Bookmarking Anteprima Filtri
Difficoltà: using previewing tools
L’anteprima che ti dà la vista completa Preview multiple ads at once Instantly QA ad View ad info Collaborate with others
Difficoltà: ripetitive attività di trafficking
Centinaia di Banners, in un solo Step Upload pairs of consistently named SWFs and GIFs Assegna la Clickthru URL a tutti gli Ads
Difficoltà: ottimizza le creatività in pochi minuti
Modifica istantanea di Testo, Contenuto o Targeting • Permette veloci ottimizzazioni e cambiamenti • Tiene traccia di ogni modifica • Si spende meno per le modifiche Smart Instantaneous creative update Versioning
Difficoltà o Incubo: F5 F5 F5 F5 F5 F5 F5 F5 F5 F5 Costanti aggiornamenti del browser F5
Screenshots Automatici “Oh Wow!, si sta realizzando un sogno!!” -Liquid Advertising In un click gli screenshots dei giustificativi in PowerPoint! AdSnap
Difficoltà: il giustoad alla giustapersona al momentogiusto
Targeting e Sequencing £ $ • Ruotai tuoi rich e standard ads, come imessaggi per assicurare la migliore user experience • Imposta l’ottimizzazione sulla metrica preferita • Frequency cap per orario, placement, e fascia oraria € Controlla la sequenza, larotazione e la frequenza dei tuoi ads Risparmia suicosti di ad servinge ottienimiglioriperformance
Open Workflow Tool avanzati e processi che lavorano con te