Download
1 / 21
210 likes | 315 Views
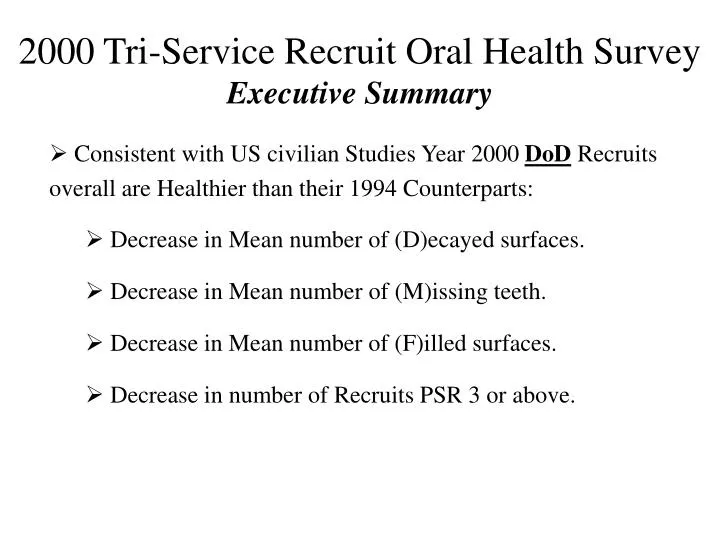
2000 Tri-Service Recruit Oral Health Survey Executive Summary. Consistent with US civilian Studies Year 2000 DoD Recruits overall are Healthier than their 1994 Counterparts: Decrease in Mean number of (D)ecayed surfaces. Decrease in Mean number of (M)issing teeth.

E N D
2000 Tri-Service Recruit Oral Health SurveyExecutive Summary • Consistent with US civilian Studies Year 2000 DoD Recruits overall are Healthier than their 1994 Counterparts: • Decrease in Mean number of (D)ecayed surfaces. • Decrease in Mean number of (M)issing teeth. • Decrease in Mean number of (F)illed surfaces. • Decrease in number of Recruits PSR 3 or above.
2000 Tri-Service Recruit Oral Health SurveyExecutive Summary (cont.) • Year 2000 Army Recruits compared to their 1994 Counterparts: • Virtually unchanged in Mean numbers of (D)ecayed surfaces and (M)issing teeth. • Decrease in Mean number of (F)illed surfaces. • Decrease in number of Recruits PSR 3 or above. • While projected per Recruit Means for DWV’s have decreased, seriousness (Class 3) of OS requirements have increased.
2000 Tri-Service Recruit Oral Health Survey Year 1994 and 2000 Army Recruit Comparisons to the DoD on Significant Study Questions Study by the Tri-Service Center for Oral Heath Studies at USUHS
2000 Tri-Service Recruit Oral Health SurveyConventions Used In This Summary • Significance has been calculated to the 99th percent. • A single or double Asterisk (*, **) will appear next to a value or item when statistically significant changes are noted. • A green arrow ( ) is often used to help identify findings of interest. • Tables of Mean Values will include the Confidence Interval in Brackets ( e.g.. Mean = 342.4 [313.2-371.6] ) • All values are subject to rounding in the summary charts and tables, calculations of significance were performed prior to any rounding to prevent errors. • All results were calculated using weighted values to insure true population representation by the samples.
2000 Tri-Service Recruit Oral Health Survey Study Sample • For the DoD: 2711 Recruits were examined in 1994; while 4346 Recruits were examined in 2000. • For the Army: 535 Recruits were examined at Ft. Leonard Wood in 1994; for year 2000, examinations were performed at Ft. Jackson, Ft. Leonard Wood and Ft. Knox, with a total of 1672 Recruits being evaluated. • Demographics of Study Samples (race, gender, educational level, etc) were consistent with Recruit populations as a whole as reported by DMDC.
2000 Tri-Service Recruit Oral Health SurveyDental Readiness • Significant INCREASE in percent of incoming 2000 Army Recruits in Dental Readiness Class 3 when compared to the 1994 Army Recruits. • No real change in 2000 DoD Recruits vs. 1994 DoD Recruits.
2000 Tri-Service Recruit Oral Health SurveyMissing Teeth • Significant DECREASE in Percent of incoming 2000 Army Recruits with missing teeth compared to 1994 Army Recruits. • Significant DECREASE in the Percent of 2000 DoD Recruits with missing teeth compared to 1994 DoD Recruits.
2000 Tri-Service Recruit Oral Health SurveyRestorations Needed Per Recruit • No significant change for incoming 2000 Army Recruits vs. 1994 Army Recruits. • 2000 DoD Recruits have significantly LOWER restorative needs compared to 1994 DoD Recruits.
2000 Tri-Service Recruit Oral Health SurveyRestorations Needed Per Recruit (By Type) • No significant change for incoming 2000 Army Recruits vs. 1994 Army Recruits. • Significant decrease in mean number of 1&2 Surface Restorations required by 2000 DoD Recruits compared to 1994 DoD Recruits
2000 Tri-Service Recruit Oral Health SurveyDental Readiness Classification Based Only On Restorative Needs No Significant Change
2000 Tri-Service Recruit Oral Health SurveyPercent Distribution of Class 3 Teeth (Restorative) • Significant DECREASE in percent of 2000 Army Recruits who have 2 Class 3 Teeth compared to 1994 Army Recruits, but overall Class 3 Restorative intensity for Army Recruits is virtually unchanged. • Significant INCREASE in percent of 2000 DoD Recruits who have only 1 Class 3 Tooth compared to 1994 DoD Recruits.
2000 Tri-Service Recruit Oral Health SurveyNumber of Teeth Requiring Extraction • Significant INCREASE in percent of 2000 Army Recruits who require 5 or More teeth extracted compared to 1994 Recruits. • Significant DECREASE in percent of 2000 DoD Recruits who require “No” or “1 to 2” teeth extracted, with a significant INCREASE in the percent requiring > 2 Teeth extracted when compared to the 1994 DoD Recruits.
2000 Tri-Service Recruit Oral Health SurveyTypes of Extractions For Recruits With OS Treatment Needs • An INCREASE in the mean number of “Simple” extractions for 2000 Army Recruits is offset by equivalent DECREASES in “Complex” & “Impaction” extractions when comparing to the 1994 Army Recruits • INCREASES in the mean number of “Simple” & “Impaction” extractions for 2000 DoD Recruits were noted when comparing to 1994 DoD Recruits
2000 Tri-Service Recruit Oral Health SurveyDental Readiness Classification Based Only On Oral Surgery Needs Note Significant INCREASE in Class 3 percentage
2000 Tri-Service Recruit Oral Health SurveyPercent Distribution Of Recruits By PSR Code • Significant DECREASE in percent of 2000 Army Recruits with PSR Code 3 compared to 1994 Army Recruits • Significant DECREASE in percent of 2000 DoD Recruits with PSR Code 2 & 3 compared to 1994 DoD Recruits
2000 Tri-Service Recruit Oral Health SurveyDental Readiness Classification Based Only On Periodontal Needs Note Significant Changes
2000 Tri-Service Recruit Oral Health SurveyPeriodontal Sextant Readiness Classification • No Significant change for incoming 2000 Army Recruits vs. 1994 Army Recruits. • No change in 2000 DoD Recruits compared to 1994 DoD Recruits
2000 Tri-Service Recruit Oral Health SurveyFixed Prosthodontic Needs • Significant DECREASE in percent of 2000 Army Recruits who require Fixed Pros Units compared to 1994 Army Recruits. • Similar significant DECREASE in percent of 2000 DoD Recruits who require Fixed Pros Units compared to 1994 DoD Recruits.
2000 Tri-Service Recruit Oral Health SurveyEndodontic Needs • Significant DECREASE in percent of 2000 Army Recruits who require Endodontics compared to 1994 Army Recruits. • No Significant change in 2000 DoD Recruits compared to the 1994 DoD Recruits.
2000 Tri-Service Recruit Oral Health SurveyPercent Distribution Of Endodontic Needs By Type
2000 Tri-Service Recruit Oral Health SurveyDWV’s By Discipline Note Significant changes