Ecological Patterns of Productivity: LTER Analysis
Explore the impact of precipitation and temperature on primary productivity using LTER data. Analyze, compare, and draw conclusions to support ecological rules.


Ecological Patterns of Productivity: LTER Analysis
E N D
Presentation Transcript
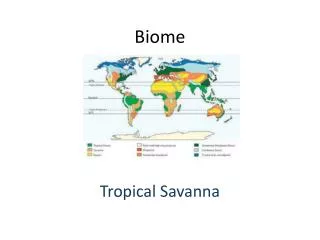
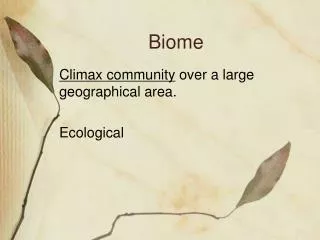
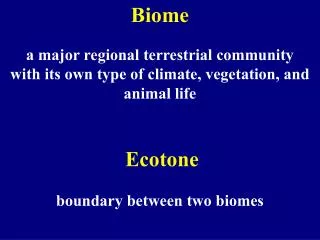
Biome Productivity Exercise The Long Term Ecological Research (LTER)
The Assignment • You have been assigned to a random group of 4 students • Read the first section of Knapp et al. (2004). • Your group has been assigned 2 LTER sites from the LTER Primary Productivity database on the MS Excel file named: LTER anpp-precip.xls • Additional information can be obtained from the following web sites: • http://www.lternet.edu/ • Search for patterns that describe the effect of precipitation and temperature on primary productivity • Approximately 25 years worth of data are available for exploration and for plotting graphs • Construct a scatter plot using Excel and copy and paste it into into PowerPoint
What to turn in. • A statement of the ecological rule rule you think supports your data (e.g., as temp. increases, NPP decreases) • Two graphs based on the data (Excel imported into a PowerPoint) • Test the rule by comparing the figures from your LTER sites to those constructed using data from two different LTER sites • Use what you know about biomes and the factors affecting primary productivity from the lecture, the web sites listed previously and the text to answer the question below. • “Is the rule supported?”. • If it is not supported, propose one or two reasons that could explain why not • If it is supported, propose one or two other factors that were not measured or included in the database that might alter the patterns you observed in the first two LTER sites.
Deadline • Create a PowerPoint presentation with no more than three slides of data on your assigned LTER Sites (be sure to include units on your graphics). • In class we will do the following: • I will select a few examples, which will be presented in class and used for discussion. • We will examine how “ecological rules” are used to describe the behavior of ecosystems given certain boundaries. • This is worth 20 points.
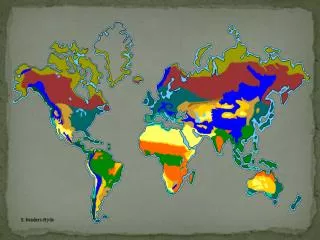
LTER Locations TL HB CC
LTER Assignment Combinations • Find your group number. It will indicate which two sites you are to compare in generating your ecological rule. • Test your rule by examining the data from two different sites, and explain whether or not these sites fit the rule.