Download
1 / 58
760 likes | 1.16k Views
Capacity and Aggregate Planning . Aggregate Planning. The process of planning the quantity and timing of output over the intermediate range (3-18 months) by adjusting production rate, employment, inventory

E N D
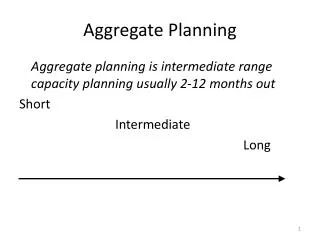
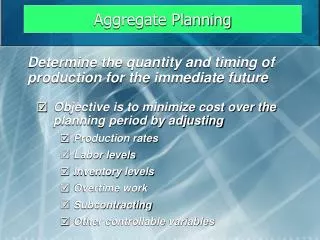
Aggregate Planning • The process of planning the quantity and timing of output over the intermediate range (3-18 months) by adjusting production rate, employment, inventory • Master Production Schedule: formalizes the production plan and translates it into specific end item requirements over the short to intermediate horizon
Capacity Planning • The process of determining the amount of capacity required to produce in the future. May be at the aggregate or product line level • Master Production Schedule - anticipated build schedule • Time horizon must exceed lead times for materials
Capacity Planning • Look at lead times, queue times, set up times, run times, wait times, move times • Resource availability • Material and capacity - should be in synch • driven by dispatch list - listing of manufacturing orders in priority sequence - ties to layout planning • load profiles - capacity of each section
Capacity Planning • Rough Cut Capacity Planning - process of converting the master production schedule into requirements for key resources • capacity requirements plan - time-phased display of present and future capacity required on all resources based on planned and released orders
Capacity Planning • Capacity Requirements Planning (CRP) - process of determining in detail the amount of labor and machine resources required to meet production plan • RCCP may indicate sufficient capacity but the CRP may indicate insufficient capacity during specific time periods
Theory of Constraints • Every system has a bottle neck • capacity of the system is constrained by the capacity of the bottle neck • increasing capacity at other than bottle neck operations does not increase the overall capacity of the system • inertia of change can create new bottle necks
Capacity Planning • Establishes overall level of productive resources • Affects lead time responsiveness, cost & competitiveness • Determines when and how much to increase capacity
Capacity Expansion • Volume & certainty of anticipated demand • Strategic objectives for growth • Costs of expansion & operation • Incremental or one-step expansion
(a) Capacity lead strategy (b) Capacity lag strategy Capacity Demand Units Units Demand Capacity Time Time (c) Average capacity strategy (d) Incremental vs. one-step expansion One-step expansion Capacity Units Units Incremental expansion Demand Demand Time Time Capacity Expansion Strategies Figure 9.1
Advantages anticipates demand first to market lure from competitors Disadvantages product problems product acceptability consumers unfamiliar with product R&D costs Lead
Advantages established demand for product less R&D growth market Follower strategy when to enter market - downside if too late in life cycle loss of customers to first to market Lag Assumes customers lost to Lead strategy will return - Western Sizzlin’
Advantages level production stable work force excess capacity potential Chasing half the time market timing excess product Average Capacity
Aggregate Production Planning (APP) • Matches market demand to company resources • Plans production 6 months to 12 months in advance • Expresses demand, resources, and capacity in general terms • Develops a strategy for economically meeting demand • Establishes a company-wide game plan for allocating resources • also called Sales and Operations Planning
Sales and Operations Planning (S&OP) • Brings together all plans for business • performed at least once a month
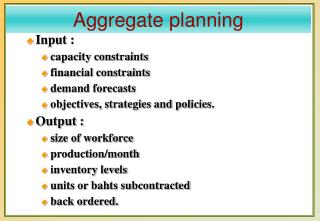
Capacity Constraints Strategic Objectives Company Policies Aggregate Production Planning Demand Forecasts Financial Constraints Size of Workforce Production per month (in units or $) Inventory Levels Units or dollars subcontracted, backordered, or lost Inputs and Outputs to APP Figure 9.3
Adjusting Capacity to Meet Demand Producing at a constant rate and using inventory to absorb fluctuations in demand (level production) Hiring and firing workers to match demand (chase demand) Maintaining resources for high demand levels Increase or decrease working hours (overtime and undertime) Subcontracting work to other firms Using part-time workers Providing the service or product at a later time period (backordering)
Strategy Details • Level production - produce at constant rate & use inventory as needed to meet demand • Chase demand - change workforce levels so that production matches demand • Maintaining resources for high demand levels - ensures high levels of customer service
Strategy Details • Overtime & undertime - common when demand fluctuations are not extreme • Subcontracting - useful if supplier meets quality & time requirements • Part-time workers - feasible for unskilled jobs or if labor pool exists • Backordering - only works if customer is willing to wait for product/services
Demand Production Units Time Level Production Figure 9.4 (a)
Advantages stable work force no overtime or additional hiring costs Disadvantages inventory obsolescence carrying costs depends on real good forecasts Level Production
Demand Production Units Time Chase Demand Figure 9.4 (b)
Advantages less inventory less chance for obsolete merchandise Disadvantages Never a stable production level work force instability hiring/firing costs always a priority Chase Strategy
Demand Management • Shift demand into other periods • Incentives, sales promotions, advertising campaigns • Offer product or services with countercyclical demand patterns • Partnering with suppliers to reduce information distortion along the supply chain
Available to Promise -ATP • Why is it important? • What is its use? The uncommitted portion of a company’s inventory and planned production maintained in the master schedule to support customer ordering promising. Portion of on hand inventory and planned production not already tied to a customer order
Product Request Is an alternative product available at an alternate location? Yes Yes Is the product available at this location? Available-to-promise No No Allocate inventory Capable-to-promise date Yes Is an alternative product available at this location? Available-to-promise Is the customer willing to wait for the product? No Yes Allocate inventory Revise master schedule Is this product available at a different location? Yes No Trigger production Lose sale No Available-to-Promise Figure 9.6
Aggregate Planning for Services Most services can’t be inventoried Demand for services is difficult to predict Capacity is also difficult to predict Service capacity must be provided at the appropriate place and time Labor is usually the most constraining resource for services
Chapter 12 Inventory Management To Accompany Russell and Taylor, Operations Management, 4th Edition, 2003 Prentice-Hall, Inc. All rights reserved.
Why is Inventory Important to Operations Management? • The average manufacturing organization spends 53.2% of every sales dollar on raw materials, components, and maintenance repair parts • Inventory Control – how many parts, pieces, components, raw materials and finished goods
Inventory Conflict • Accounting – zero inventory • Production – surplus inventory or “just in case” safety stocks • Marketing – full warehouses of finished product • Purchasing – caught in the middle trying to please 3 masters
Inventory • Stock of items held to meet future demand • Insurance against stock out • Coverage for inefficiencies in systems • Inventory management answers two questions • How much to order • When to order
Types of Inventory • Raw materials • Purchased parts and supplies • Labor • In-process (partially completed) products • Component parts • Working capital • Tools, machinery, and equipment • Safety stock • Just-in-case
Reasons to Hold Inventory • Meet unexpected demand • Smooth seasonal or cyclical demand • Meet variations in customer demand • Take advantage of price discounts • Hedge against price increases • Quantity discounts
Two Forms of Demand • Dependent • Items used to produce final products • Easier to forecast • Independent • Items demanded by external customers • Example – repair parts
Aggregate Inventory Management • How much do we have now? • How much do we want? • What will be the output? • What input must we get? • Correctly answering the question about when to order is far more important than determining how much to order.
Inventory Costs • Carrying Cost • Cost of holding an item in inventory • As high as 25-35% of value • Insurance, maintenance, physical inventory, pilferage, obsolete, damaged, lost • Ordering Cost • Cost of replenishing inventory • Shortage Cost • Temporary or permanent loss of sales when demand cannot be met
Inventory Control Systems • Continuous system • Constant amount ordered when inventory declines to predetermined level • variable amount ordered when inventory reaches Reorder Point • Periodic system (fixed-time-period) • Order placed for variable amount after fixed passage of time
PERCENTAGE PERCENTAGE CLASS OF UNITS OF DOLLARS A 5 - 15 70 - 80 B 30 15 C 50 - 60 5 - 10 ABC Classification System • Demand volume and value of items vary • Classify inventory into 3 categories, typically on the basis of the dollar value to the firm
PART UNIT COST ANNUAL USAGE 1 $ 60 90 2 350 40 3 30 130 4 80 60 5 30 100 6 20 180 7 10 170 8 320 50 9 510 60 10 20 120 ABC Classification Example 10.1
TOTAL % OF TOTAL % OF TOTAL PART VALUE VALUE QUANTITY % CUMMULATIVE PART UNIT COST ANNUAL USAGE 9 $30,600 35.9 6.0 6.0 8 16,000 18.7 5.0 11.0 2 14,000 16.4 4.0 15.0 1 5,400 6.3 9.0 24.0 4 4,800 5.6 6.0 30.0 3 3,900 4.6 10.0 40.0 6 3,600 4.2 18.0 58.0 5 3,000 3.5 13.0 71.0 10 2,400 2.8 12.0 83.0 7 1,700 2.0 17.0 100.0 $85,400 1 $ 60 90 2 350 40 3 30 130 4 80 60 5 30 100 6 20 180 7 10 170 8 320 50 9 510 60 10 20 120 ABC Classification Example 10.1
TOTAL % OF TOTAL % OF TOTAL PART VALUE VALUE QUANTITY % CUMMULATIVE PART UNIT COST ANNUAL USAGE 9 $30,600 35.9 6.0 6.0 8 16,000 18.7 5.0 11.0 2 14,000 16.4 4.0 15.0 1 5,400 6.3 9.0 24.0 4 4,800 5.6 6.0 30.0 3 3,900 4.6 10.0 40.0 6 3,600 4.2 18.0 58.0 5 3,000 3.5 13.0 71.0 10 2,400 2.8 12.0 83.0 7 1,700 2.0 17.0 100.0 $85,400 1 $ 60 90 2 350 40 3 30 130 4 80 60 5 30 100 6 20 180 7 10 170 8 320 50 9 510 60 10 20 120 ABC Classification A B C Example 10.1
Why ABC? • Inventory controls • Security controls • Monetary constraints • Storage locations
Another Form of ABC • Not monetary based • Use annual demand quantities • Used to determine storage locations in warehouse/distribution center • Establish golden zones in the warehouse for items that are fast moving, at ergonometric picking levels • Cross Docking
Assumptions of Basic EOQ Model • Demand is known with certainty and is constant over time • No shortages are allowed • Lead time for the receipt of orders is constant • The order quantity is received all at once
No reason to use EOQ if: • Customer specifies quantity • Production run is not limited by equipment constraints • Product shelf life is short • Tool/die life limits production runs • Raw material batches limit order quantity
The Inventory Order Cycle Order quantity, Q Demand rate Inventory Level Reorder point, R 0 Time Lead time Lead time Order placed Order receipt Order placed Order receipt
Annual ordering cost = CoD Q CoD Q Annual carrying cost = CcQ 2 CcQ 2 Total cost = + EOQ Cost Model Co - cost of placing order D - annual demand Cc - annual per-unit carrying cost Q - order quantity