Aggregate Planning
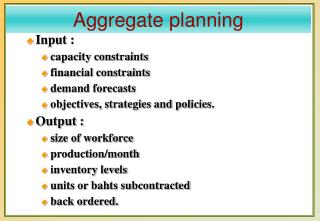
Aggregate Planning. Operations Planning Overview The hierarchical planning process Aggregate production planning Examples: Chase and Level strategies. Operations Planning Overview. Long-range planning Greater than three year planning horizon Usually with yearly increments

Aggregate Planning
E N D
Presentation Transcript
Aggregate Planning • Operations Planning Overview • The hierarchical planning process • Aggregate production planning • Examples: Chase and Level strategies
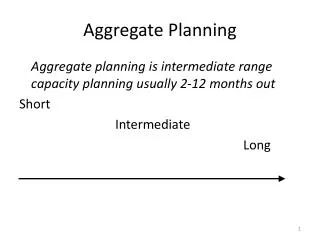
Operations Planning Overview • Long-range planning • Greater than three year planning horizon • Usually with yearly increments • Intermediate-range planning • 1 to 3 years • Usually with monthly or quarterly increments • Short-range planning • One year • Usually with weekly increments
Workforce & Customer Scheduling Daily Workforce & Customer Scheduling Strategic Planning Long- range Sales Planning Intermediate- range Aggregate Planning Master Production Scheduling Product/Service Schedule Resource Requirements Planning Mat’ls, Capacity, Manpower Order Scheduling Production/Purchases Short- range
Decision Level Decision Process Forecasts needed Allocates production among plants Annual demand by item and by region Corporate Determines seasonal plan by product type Monthly demand for 15 months by product type Plant manager Determines monthly item production schedules Monthly demand for 5 months by item Shop superintendent Hierarchical Production Planning Exhibit 12.2
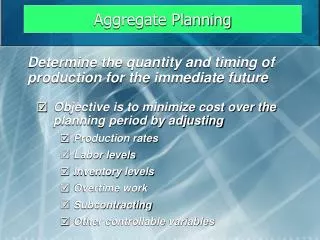
Aggregate Planning • Goal: Specify the optimal combination of • production rate (units completed per unit of time) • workforce level (number of workers) • inventory on hand (inventory carried from previous period) • Product group or broad category (Aggregation) • Intermediate-range planning period: 6-18 months
Balancing Aggregate Demandand Aggregate Production Capacity 10000 Suppose the figure to the right represents forecast demand in units. 10000 8000 8000 7000 6000 5500 6000 4500 Now suppose this lower figure represents the aggregate capacity of the company to meet demand. 4000 2000 0 Jan Feb Mar Apr May Jun 9000 10000 What we want to do is balance out the production rate, workforce levels, and inventory to make these figures match up. 8000 8000 6000 6000 4000 4500 4000 4000 2000 0 Jan Feb Mar Apr May Jun
Key Strategies for Meeting Demand • Chase • Level • Some combination of the two
STRATEGIES ACTIVE WRT DEMAND • USE MARKETING TO SMOOTH DEMAND • EXAMPLES • PRICE • PRODUCT • PLACE • PROMOTION
Proactive Demand Management to Equate Supply and Demand 10000 SEASONAL DEMAND - SNOW SKIIS 8000 6000 4000 2000 0 CONTRA-SEASONAL DEMAND - _______________ 10000 8000 6000 4000 2000 0
Proactive Demand Management to Equate Supply and Demand 10000 CYCLICAL DEMAND - NEW CARS 8000 6000 4000 2000 0 CONTRA-CYCLICAL DEMAND - __________________ 10000 8000 6000 4000 2000 0
Jason Enterprises Aggregate Planning Examples: Unit Demand and Cost Data Suppose we have the following unit demand and cost information: Demand/mo Jan Feb Mar Apr May Jun 500 600 650 800 900 800 Days per month 22 19 21 21 22 Materials $100/unit Holding costs $10/unit per mo. Marginal cost of stockout $20/unit per mo. Hiring and training cost $50/worker Layoff costs $100/worker Labor hours required . 4 hrs/unit Straight time labor cost/OT $12.50/18.75/hour Beginning inventory 200 units Productive hours/worker/day 8.00 Paid straight hrs/day 8