Download
1 / 27
280 likes | 418 Views
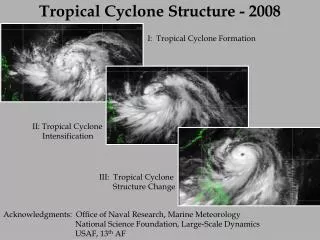
FUTURE TROPICAL CYCLONE GUIDANCE FROM THE COMBINED TCS08/T-PARC FIELD EXPERIMENT. Russell L. Elsberry Graduate School of Engineering & Applied Sciences Department of Meteorology Naval Postgraduate School Monterey, California Outline

E N D
FUTURE TROPICAL CYCLONE GUIDANCE FROM THE COMBINED TCS08/T-PARC FIELD EXPERIMENT Russell L. ElsberryGraduate School of Engineering & Applied SciencesDepartment of MeteorologyNaval Postgraduate SchoolMonterey, California Outline Overview – Tropical Cyclone Structure (TCS08)/THORPEX Pacific Asian Regional Campaign Short-term guidance improvement opportunities Longer-term research leading to improved guidance 2009 Tropical Cyclone Conference, Ford Island, Hawaii, 29 April – 1 May 2009
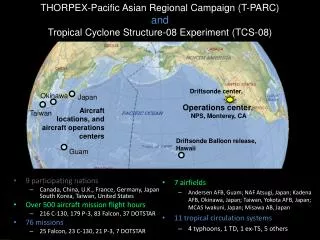
Subtropical operating region Driftsonde, NRL P-3, DOTSTAR, WC-130 TC Intensification and structure change Recurvature, initiation of ET TC track characteristics, tropical/midlatitude interaction T-PARC/TCS-08 Components TY Nabi, 29 Aug – 8 Sep, 2005 Midlatitude operating region NRL P-3, FALCON Extratropical Transition (ET – recurvature), Downstream Impacts Japan, Atsugi, NAF ET characteristics, forcing of downstream impacts, tropical/midlatitude interactions, extratropical cyclogenesis Tropical operating region Driftsonde, NRL P-3, DOTSTAR, WC-130 Okinawa, Kadena AFB Tropical Measurements Large-scale circulation, deep convection, monsoon depressions, tropical waves, TC formation Guam, Andersen AFB
Operations: Aircraft • Mission objectives • NRL P-3 • TC formation, structure, intensification, TUTT structure, targeting for formation, extratropical transition • WC-130J • TC formation, structure, intensification, satellite validation, targeting for formation and track, extratropical transition • FALCON • Typhoon targeting, extratropical transition, targeting, ridge-building, tropical water vapor transport • DOTSTAR • Typhoon targeting
Operations by the numbers… • 9 participating nations • Canada, China, England, France, Germany, Japan, South Korea, Taiwan, United States • Over 500 aircraft mission flight hours • 216 C-130, 179 P-3, 83 Falcon, 37 DOTSTAR • 76 missions • 25 Falcon, 23 C-130, 21 P-3, 7 DOTSTAR • 7 airfields • Andersen AB, Guam; NAF Atsugi, Japan; Kadena AB, Japan; Taiwan, Yokota AB, Japan; MCAS Iwakuni, Japan; Misawa AB, Japan • 11 tropical circulation systems • 4 typhoons, 1 TD, 1 ex-TS, 5 others
Tropical Circulation Systems by the numbers… • During August – September, there were 12 total systems > TD intensity over the western North Pacific • 4 typhoons, 4 tropical storms, 4 TDs • 51 TCS systems • With a few recycled a time or two • 11 systems in which aircraft missions were flown • 4 typhoons, 1 TD, 1 ex-TS, 5 others • 72% of all missions were flown on the 4 typhoon cases • 6 Nuri, 28 Sinlaku, 5 Hagiput, 15 Jangmi (54/75 = 72%)
TCS08/T-PARC Summary • Anomalous weather conditions to start • Non-existent monsoon trough • Anomalous low-level easterlies • Weak wave activity and strong upper-level cold lows (TUTT) dominated throughout August • 1 typhoon • However, many aircraft missions conducted for TC formation, wave structure, TUTT structure, subtropical cyclone development • Active September • 3 typhoons (1 super typhoon, i.e. cat 5) • 2 recurvature tracks • Successfully addressed all science objectives in field phase
SHORT-TERM GUIDANCE IMPROVEMENT OPPORTUNITIES • TCS08 satellite validation exercise [Provided by Chris Velden] • Targeted observations for track/formation/intensity [Details in Carolyn Reynolds and Jim Doyle talks] • COAMPS-TC model improvements [Details in Jim Doyle talk] • Tropical cyclone formation bulletin (??) 2009 Tropical Cyclone Conference, Ford Island, Hawaii, 29 April – 1 May 2009
TCS08/T-PARC SATELLITE VALIDATION • Objective is to validate satellite-based estimates of minimum sea-level pressure and maximum surface winds in western North Pacific • Expert satellite analysts selected to do “blind satellite estimates” during selected periods with aircraft reconnaissance, i.e., they had access only to satellite observations with no knowledge of aircraft or other observations STORM VALIDATION OBSERVATIONS Number Name C-130 P-3 Buoy 13W Nuri 2 2 15W Sinlaku 7 1 18W Hagapit 0 0 1 19W Jiangmi 3 0 1 • Best-track team was formed to evaluate all in situ validation observations during these periods • Chris Velden research team will then validate satellite estimates 2009 Tropical Cyclone Conference, Ford Island, Hawaii, 29 April-1 May 2009
Satellite-Based TC Intensity EstimatesValidation Campaign using TCS-08 Recon } Objective Methods Subjective Methods Typhoon Nuri } TCS-08 Recon Max Wind (Kts)
Satellite-Based TC Intensity EstimatesValidation Campaign using TCS-08 Recon • Preliminary Findings • (Based on limited sample of 15 recon validation points) • Ave Vmax estimate errors (kts): subj Dvorak ~ 11 (blind*), 13 (oper*), 14 (obj-ADT*) • Subj Dvorak ave error spread (kts): 8-17 (blind-5 analysts), 11-15 (oper-3 agencies) • [JMA (incl their Koba et al. Tnum>Vmax adjustment) superior to other 2 agencies] • AMSU* and SATCON* ave errors (kts): Both ~ 9 (subset of 13 validation pts) • ‘Blind’ = No access to real time recon or oper estimates of intensity • ‘Oper’ = Operational fix agencies (JTWC, NESDIS-SAB, JMA) • ‘ADT’ = Advanced Dvorak Technique (UW-CIMSS obj method) • ‘AMSU’ = Advanced Microwave Sounding Unit (UW-CIMSS obj method) • ‘SATCON’ = SATellite CONsensus (UW-CIMSS weighted con. of ADT and AMSU) • General Preliminary Conclusions • Objective methods are very competitive • Significant spread in subjective Dvorak estimates • Consensus improves accuracies for all methods
Targeting Motivation: Track Uncertainty 10 September ECMWF Strike Probability JMA Ensemble Members Numerical model aids
EXAMPLE OF COAMPS-TC PREDICTION OF NURI (J. Hensley thesis)Grid 2 Simulated Radar Reflectivity from the 1200 UTC 16 August model run +72 Forecast • The 72-h forecast did the best except on the location of Nuri. Captured the structure well. Microwave Satellite Imagery valid at 1121 UTC 19 August • The 72-h forecast depicts the distribution of the convection quite well • Radar now indicates a closed eye with heaviest convection on the south/southwest side which lines up well to the satellite image • The forecast does however over forecast the precipitation on the western side of the storm Forecast position Images courtesy of http://www.nrlmry.navy.mil/sat_products.html
JUSTIFICATION FOR TROPICAL CYCLONE FORMATION BULLETINS Evaluated performance of four global models for the pre-tropical cyclone to tropical cyclone formation stages during the TCS08/T-PARC period Track predictions Model representation of circulations during these early stages Model error tendencies in predicting tropical cyclone formation Effectiveness of subjective evaluation of model predictions NOGAPS: Navy Operational Global Atmospheric Prediction System ECMWF: European Center for Medium-range Weather Forecasts GFS: Global Forecast System (National Centers of Environmental Prediction) UKMO: United Kingdom Meteorological Office 2009 Tropical Cyclone Conference, Ford Island, Hawaii, 29 April – 1 May 2009
2009 Tropical Cyclone Conference, Ford Island, Hawaii, 29 April – 1 May 2009
Example of a subjective evaluation of a Likely (L) or Unlikely (U) tropical cyclone formation during the four global models 120-h forecast period. The sequence of forecasts start from 1200 UTC (12Z) 21 September 2008 when a tropical wave was first identified in all four model analyses and continues to 1200 UTC 28 September, which is 18 h before the Joint Typhoon Warning Center labeled the circulation as Tropical Depression 21W. DTG/MODEL Analysis Position NOGAPS ECMWF GFS UKMO 21/12Z ~08N 160-165E U U U U 22/12Z 07N 163E U U U U 23/12Z 07N 160E U U U U 24/12Z 08N 150E – 155E L 72 h L 120 h L 72 h L 48 h 25/12Z 08N 151E UL 120 h UL 120 h 26/12Z 09N 146E U U UL 72 h 27/12Z 09N 141E L 36 h L 48 h L 36 h L 48 h 28/12Z 08N 132E L 24 h L 12 h L 12 h L 12 h 29/06Z Tropical Depression 21W: 09N 131E warning #1 2009Tropical Cyclone Conference, Ford Island, Hawaii, 29 April – 1 May 2009
CONCLUSIONS RELATED TO TROPICAL CYCLONE FORMATION PREDICTION An experienced analyst is able to define individual model characteristics and tendencies related to the pre-tropical cyclone seedling to tropical cyclone formation transition Application of these model tendencies has led to subjective evaluations of Likely or Unlikely tropical cyclone formation predictions When all four global model forecasts are in agreement as to position and evolution, high confidence can be given to the prediction scenario with relatively few false alarms (four in two months) Most successful for those seedlings that will later become strong tropical storms or typhoons; Not successful in predicting seedlings that would only attain tropical depression or weak tropical storm 2009 Tropical Cyclone Conference, Ford Island, Hawaii, 29 April – 1 May 2009
Based on the western North Pacific TCs during TCS08, this study suggests possibility of using a consensus of dynamical model predictions to create a tropical cyclone formation bulletin with a likely formation time, location, and (say) 72-h track. Tracking of the pre-tropical cyclone seedlings can be done objectively with the VORTRACK technique produced by Pat Harr An experienced analyst is required to monitor the performance of the various dynamical model predictions in the basin and to assess the Likely or Unlikely formation in each prediction. Key to success is a consensus of dynamical model predictions just as has been successful in track prediction. 2009 Tropical Cyclone Conference, Ford Island, Hawaii, 29 April – 1 May 2009
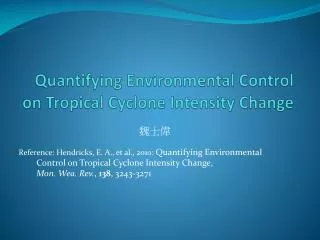
LONGER-TERM RESEARCH LEADING TO IMPROVED GUIDANCE Studies of TC formation/structure change Mesoscale versus environment contribution to formation Boundary layer impact on air-sea fluxes Ocean variability impact on intensity Buoy drops in front of two TCs, including Category 5 Model intercomparison study for Sinlaku Intraseasonal tropical cyclone formation prediction [Statistical approach in David Meyer talk] ECMWF 32-day ensemble prediction system (also tracks) 2009 Tropical Cyclone Conference, Ford Island, Hawaii, 29 April – 1 May 2009
Circulation center Potential initial eyewall formation From Michael Bell and Wen-Chau Lee, NCAR/EOL
Operations: Aircraft – buoy deployment First occurrence of the deployment of drifting buoys ahead of a category 5 tropical cyclone (Jangmi). Chart at left and imagery below are from a few hours after the deployment of the buoys along the diagonal to the northwest of the TC 2313 UTC 26 September First buoy deployment In TY Hagupit several days earlier P-3 flight track Second deployment in STY Jangmi Buoy, aircraft, and satellite data in Google Earth
TCS08/T-PARC Firsts First operation of WC-130Js at 31,000 ft altitude except when penetrating a mature TC Dropped sondes and AXBTs from high altitude Timed with passage of polar-orbiting satellites for satellite intensity validation First systematic targeting operation in the WPAC Comparison of several methods from a variety of operational and research organizations Multiple aircraft ECMWF/UKMO Data Targeting System First four plane operation in a WPAC TC First buoy drop in front of a WPAC TC Two TCs First time a category 5 TC passed over buoys dropped in its path First systematic observations of full extratropical transition process Multiple aircraft and land-based radar Timed with satellite overpass
CONCLUSION Highly successful combined TCS08/T-PARC field experiment due to 100s of participants and support (in U.S.) of: Office of Naval Research Naval Research Laboratory U. S. Air Force National Science Foundation Expect improved TC guidance in both short term and in longer term 2009 Tropical Cyclone Conference, Ford Island, Hawaii, 29 April – 1 May 2009
WMO CAS/WORLD WEATHER RESEARCH PROGRAM An international mesoscale model intercomparison is being organized for prediction of the landfall effects associated with Sinlaku Initial fields during period of four aircraft data sets Special data assimilation Validation data sets from Taiwan Central Weather Bureau Track of sea-level pressure center, wind fields, and circulation center at different heights (Doppler radar), precipitation Cooperating with Working Group on Numerical Experimentationon intercomparison design and invitations to modeling groups. 2009 Tropical Cyclone Conference, Ford Island, Hawaii, 29 April – 1 May 2009
Key TCS-08/TPARC Satellite Initiatives Prepared by C. Velden (UW-CIMSS) More on satellite-based support and efforts in the next presentation by J. Hawkins Impact of high-resolution (space and time) satellite-derived winds on WNP TC analysis and forecasting Demonstration and validation of satellite-based TC intensity estimation methods in the WNP Primary Support from ONR MM Program
Real time MTSAT wind vector datasets produced every hour Winds and derived fields (i.e. shear) used in TCS08/TPARC for mission planning CIMSS MTSAT-1R r/t hourly winds web site (above) now a routinely available resource to JTWC ops. The vectors are disseminated to NRL-MRY for NOGAPS model assimilation Velden/Stettner
Left: Vector field produced from a routinely available 30-min sequence of images (15W - Sinlaku) Bottom Left: Using a 15-min rapid scan sequence Bottom Right: Using a 4-min rapid scan sequence (much improved detail of TC flow fields) Wind Vectors from MTSAT Rapid Scan Images NOGAPS 4DVAR assimilation and model forecast impact studies underway Future plans for COAMPS-TC assimilation experiments
TCS-08 Data Impact ExperimentTesting impact of assimilated hourly MTSAT Atmospheric Motion Vectors (AMVs) on NOGAPS forecasts of TC track and intensity NAVDAS 4DVAR 250 hPa Analysis: Streamlines and Divergence Valid 00UTC 20 August, 2008 Nuri’s Vmax is 100 kts (JTWC) Divergence is stronger and more concentrated over TC Nuri in analysis with hourly AMVs Forecast experiments are in progress Hourly AMVs Included Hourly AMVs Denied Divergence (1x10⁻⁵ s-1) Velden/Berger/Langland