Download

1 / 58
580 likes | 597 Views
Learn how cost-effectiveness analysis impacts conservation programs and regional targets under the Council's Plan. Discover the methodology used to determine resource cost-effectiveness and how resource acquisitions align with the Act's requirements. Explore the process of estimating conservation potential and setting acquisition targets for cost-effective measures.

E N D
6th Plan Conservation Resource Cost-Effectiveness Conservation Resource Advisory Committee March 12, 2009
How the Plan’s Cost-Effectiveness Analysis Impacts Regional Conservation Programs • Council Plan • Establishes regional conservation targets based its interpretation of the Act’s requirements • Contains methodology and assumptions (e.g., future market prices, measure cost & savings) for determining cost-effectiveness • Contains specific “measure level” (e.g. high efficiency electric water heaters) determinations of cost-effectiveness • Bonneville’s resource acquisitions are to be consistent with the Council’s Plan • Utilities covered by I-937 in Washington state must adhere to the Council’s “methodology”
The Plan’s Definition of Resource Cost-Effectiveness Comes From the Regional Act • "Cost-effective,” means that a measure or resource must be forecast: • to be reliable and available within the time it is needed • to meet or reduce the electric power demand of the consumers at an estimated incremental system cost no greater than that of the least-cost similarly reliable and available alternative measure or resource, or any combination thereof.
Under the Act the term "system cost" means: • An estimate of all direct costs of a measure or resource over its effective life, including: • the cost of distribution and transmission to the consumer • waste disposal costs • end-of-cycle costs • fuel costs (including projected increases) • and such quantifiable environmental costs and benefits as are directly attributable to such measure or resource
The Act’s Definition of Cost-Effectiveness • Seeks to minimize the total cost of meeting the region’s need for the services provided by electricity, i.e., its goal is economic efficiency. • Does not address the distribution of these costs among parties in the region
The Council Does Not Use A Single Regional Avoided Cost To Determine Conservation’s Cost-Effectiveness • We Use What We Learn from the Portfolio Model • Pick any forecast of future market prices • Add “Risk Premiums” for conservation’s hedge value to that forecast (different ones for lost-opportunity & dispatchable) • Use this risk adjusted price to determine the value of the energy savings
IRP Methodology • 6th Plan is testing thousands of “plans” against 750 futures • Model identifies “plans” with the lowest cost for a given level of risk • Model tests alternative conservation deployment schedules (amount and timing) as well as “risk mitigation” benefits of buying conservation above forecast avoided cost • Regional Conservation Targets are derived from Plans on lowest-cost lowest-risk frontier
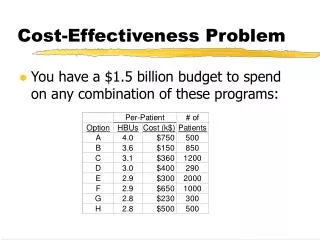
Council Process for Estimating Cost-Effective Conservation Resource Potential & Setting Acquisition Targets Measure Cost Measure Lifetime Measure Savings and Load Shape • Program Data • Contractor Bids • Retail Price Surveys • Evaluations • Census Data • Manufacturers Data • Engineering Estimates • End Use Load Research • Engineering Models • Billing History Analysis • Independent Testing Labs Portfolio Model Market Model Cost-Effectiveness Model • Determines measure and program level “cost-effectiveness” using: • Measure costs, savings & load shape • Aurora Market prices • T&D savings (losses & deferred $) • 10% Act Credit • Quantifiable non-energy costs & benefits • Financial Assumptions (e.g. Discount Rate) • Risk “Premium” from Porfolio Model Provides 20-year Forecast of Hourly Wholesale Market Prices & CO2 Emission/kWh Under Average Water Conditions, Medium Gas Price Forecast for Medium Load Growth Scenario Determines NPV of Portfolios with Alternative Levels of Conservation vs Other Resources Under Wide Range for Future Conditions Plan’s Conservation Target
Portfolio Analysis Determines How Much Energy Efficiency to Develop in the Face of Uncertainty FrequencyChart 1,000 Trials 1,000 Displayed .043 43 Portfolio Analysis Model .032 32.25 .022 21.5 .011 10.75 Mean = $689 .000 0 ($3,509) ($1,131) $1,247 $3,625 $6,003 Dollars NPV System Cost Efficient Frontier
Plans Along the Efficient Frontier Permit Trade-Offs of Costs Against Risk Least Cost Least Risk
Alternative Cost-Effectiveness Tests • Participant Cost Test (PTC) • Costs and benefits to the program participant • Total Resource Cost (TRC) • All Quantifiable costs & benefits regardless of who accrues them. Includes participant and others’ costs • Utility Cost Test (UTC) • Quantifiable costs & benefits that accrue only to the utility system. Specifically excludes participant costs • Rate Impact Measure (RIM) • Net change in electricity utility revenue requirements. • Attemptsto measure rate impact on all utility customers especially those that do not directly participate in the conservation program • Treats “lost revenues” (lower participant bills) as a cost
Plan Uses Total Resource Cost (& Benefits) Perspective • Best meets the requirements of the Regional Act • Considers all quantifiable costs & benefits regardless of who accrues them • Ensures that conservation expenditures are good for the power system, the customer and society • Allows conservation to be compared to other resources considered for development by including all quantifiable costs & benefits • Was strongly recommended by utilities in first Council Plan • Plan targets would be significantly higher if Plan had considered only “Utility Cost”
Some Utilities Now Recommend Use of Utility Cost Test Perspective • Considers only those costs & benefits that accrue to electric utility system • Energy kWh at avoided wholesale cost at time saved • Transmission & distribution kW benefits if coincident with system peak and at value of deferred expansion cost • Utility cost for incentives & program administration • Does not count customer costs or benefits • Ensure that conservation is good for the utility • Acts as the upper limit on utility incentives for measures with large non-electricity benefits • Used as a measure of utility cost efficiency • Striving for low utility cost share keeps revenue requirements lower
NEET Process Raised Additional Issues • Review method of calculating cost-effectiveness • Is the Council’s existing interpretation of the Act’s definition “too conservative”? • At what “level of aggregation” should the calculation of costs and benefits be performed? • Measure • System • Building • Program • Portfolio
Why Council Uses TRC:Avoids Potential Double Counting of the Savings • Utility invest $2500 in efficient motor to acquire 5000 kWh/yr savings • Levelized Cost = 3.4 cents/kWh • B/C = 1.32 • Customer matches $2500 utility investment to save the same 5000 kWh/yr • Simple payback = 10 years, motor last 20 years • Total of all direct cost is $5000 for 5000 kWh/yr of savings • Levelized cost = 6.8 cents/kWh • B/C ratio = 0.66
Why Council Uses TRCDirects Funds Toward Measures That Optimize Total Utility and Customer Investments • Utility invest $600 toward cost of $6000 solar PV system that saves 1200 kWh/yr • Alternatively utility and consumer could: • Invest $160 in 40 CFLs to save 1200 kWh, reducing cost $440 • Invest $600 to buy 150 CFLs, saving 5000 kWh, quadrupling savings • Especially important when budgets are limited
Why Council Uses TRCAvoids promoting measures that may impose non-energy costs on others • Act directs the Council give second priority to the use of renewable resources • Analysis in 1st Plan concluded that cost of using wood stoves to offset use of electric heat was below cost of electricity from new generating facilities • 1st Plan excluded use of wood heat due to “non-energy” cost (air pollution) imposed on the region
Why Council Uses TRCExpands list of conservation options by allowing consideration of quantifiable “non-energy” benefits • Energy Star Clothes Washer in Homes with Gas Water Heater and Dryer • Present Value Capital Cost =$58/MWh • Present Value to Power System= $17/MWh (B/C = 0.3) • Value to Region/Society (includes natural gas, detergent & water savings)= $110/MWh (B/C = 2.0) • Power system’s “willingness-to-pay” for these savings should be limited to its present value benefits • Electric Utility could provide incentive up to $17/MWh for washer in a home with gas water and dryer heat
Consideration of Non-Energy Benefits Expands the Conservation Supply Curve Conservation Resources in Plan Created by Consideration of Non-Energy Benefits
Care Must Be Used in Applying The Plan’s Cost-Effectiveness Results “Prescriptively” • Not all measures are in the draft 6th Plan • Plan contains over 1000 applications of specific EE technologies • NOT an exhaustive list of all possible measures & applications (e.g. custom measures) • Plan assumes administrative costs = 20% of capital • Administrative cost vary widely by measure & by program design • Measure cost-effectiveness in Plan is an estimate • Measure costs and savings are a single point estimate, but vary widely in practice • Plan targets are based on full portfolio model analysis, 750 forecasts of “avoided costs” • Measure/Program/Portfolio cost-effectiveness generally determined on a single forecast of “avoided costs” for the next 20 years (with adders for “hedge risk”)
Granularity/Bundling – So What’s “A Measure”? • "Resource" means-- electric power, including the actual or planned electric power capability of generating facilities, or actual or planned load reduction resulting from direct application of a renewable energy resource by a consumer, or from a conservation measure.
Why “Bundle” • Measures are interactive, so total savings are not the sum of their “parts” • Example: Heat pumps, duct sealing and commissioning • “Deeper” savings are lower cost • Example: Conversions and/upgrades to HSPF 9.0 have a higher TRC B/C ratio than to HSPF 8.5 • Adding a “non-cost effective” measure reduces cost per unit of savings by increasing market penetration • Example: Adding “prime window replacements” increases participation in weatherization program, spreading fixed cost over more savings
Risks of Bundling • Reduces in economic benefits of conservation • If the average cost of all conservation equals the avoided cost, there’s no room for a mistakes • If “non-cost effective” measure dominates program/portfolio, it places all savings at risk (i.e., not recoverable, not counted toward target) • Slippery slope – Can bundling of any measures (e.g. PVs w/CFLs) be justified? • Is there a need for consistent application across the region?
Care Must Be Used in Applying The Plan’s Cost-Effectiveness Results “Prescriptively” • Plan’s cost & savings estimates are “averages” • Site-specific applications may be more or less “cost-effective” than in Plan • The Plan “average” may not accurately reflect specific program conditions • Programs should be tailored to reflect specific program designs, delivery mechanisms, measure applications, location and other key cost or savings factors • Program estimates need to be more or less granular than Plan estimates • Individual measures evaluated in Plan are aggregated into programs/portfolios (e.g., Plan doesn’t have “Energy Star New Homes” as a measure)
Energy Efficiency is Still the Cheapest Option Assumptions : Efficiency Cost = Average Cost of All Conservation Targeted in 5th Power Plan Transmission cost & losses to point of LSE wholesale delivery No federal investment or production tax credits Baseload operation (CC - 85%CF, Nuclear 87.5% CF, SCPC 85%, Wind 32% CF) Medium NG and coal price forecast (Proposed 6th Plan) Bingaman/Specter safety valve CO2 cost
Draft 6th MWa of “Technically Achievable” Conservation Potential
Draft 6th MWa of “Technically Achievable” Conservation Potential 5th Plan Estimate
Customer Perspective • Considers only those costs & benefits that accrue to end use consumer • Electric bill savings • Quantifiable non-energy benefits • Customer share of capital & labor cost • Customer share of periodic replacement cost • Customer operation and maintenance cost/savings • Ensure that conservation is good for the customer • Common metrics: B/C ratio, by simple payback, return on investment, years to positive cash flow
Common Expressions of Cost-Effectiveness • Payback • Expressed as time to recoup investment • Benefit/Cost ratio • Expressed as a ratio • Net Present Value • Expressed as dollar value • Levelized Cost • Expressed as cost per kWh or $/MWh
Common Metrics for TRC Cost-Effectiveness Benefit/Cost Ratio • Discounted Present Value of Benefits ($) = • Discounted Present Value of Costs ($) Net Present Value = • Discounted PV of Benefits – Discounted PV of Costs ($) Levelized Cost (for comparison to other resources) • Discounted Present Value Costs Annualized over Life ($) = • Annual kWh Saved at Bus Bar (kWh)
Conservation Measure Cost-Effectiveness“Inputs and Outputs” Bulk Power System Value ECM Costs, Savings, Load Shapes & Coincidence Factors Bulk Transmission System Benefits Local Distribution System Value PNW Avoided Cost by Transmission Control Area ProCost Local Distribution System T&D Benefits Aurora West Coast Market Price Forecast Total Societal Value Non-Energy Benefits Carbon Emissions Benefits
Council 5th Plan Forecast of Future Average Monthly Market Prices(Mid C-Trading Hub)
The Council’s Conservation’s Cost-Effectiveness Analysis Compares Savings with Forecast Market Prices at the time the savings occur • Four “Load Segments” are used to compute the value of savings: • Weekday “Peak” Load Hours • Weekday “Ramp Up/Ramp Down” hours and “Weekend Peak” Load Hours • Weekday and “Weekend Off-Peak” hours • Weekend and Holiday “Very-Low”
Each Conservation Measure Has a Different “Cost-Effectiveness” Limit Based on When It’s Savings Occur Weighted Average Value of Space Heating Savings = $41/MWh Weighted Average Value of Space CoolingSavings = $78/MWh
Impact Load Shape on Regional Bulk Power System Value • Impact on Present Value Benefit (20-year measure life) • Low End • Street Lighting - $41/MWh • Residential Space Heating - $41/MWh • High End • Central AC - $78/MWh • Solar Water Heating - $74/MWh
Impact of Bulk Transmission System T&D on Power System Value • Assumed Bulk Transmission System “Avoided Cost” of $3.00/kW-year • Impact on Present Value Benefit (20 year measure life) • Low end • Irrigated Agriculture - $0.00/MWh • Residential AC - $0.00/MWh • High end • Residential Space Heating - $1.05/MWh • Residential Water Heating - $0.52/MWh
Local Transmission and Distribution Benefits • There is value in delaying utility investments in local distribution networks (and sub-High Voltage Transmission) that is caused by load growth • Not all load growth results in the immediate need to increase local distribution system network capacity • Other “Demand Side Management” (e.g. load control) programs may be better suited to deferring network expansion • The value of reducing load growth defer distribution capacity expansions: Capital expansion cost/KW-yr * Probability expansion will be deferred by conservation measure’s impact on distribution system peak
Impact of Local T&D on Power System Value • Assumed Local Distribution System “Avoided Cost” of $20/kW-year • Impact on Present Value Benefit (20-year measure life) • Low end • Solar PV - $0.14/MWh • Solar Water Heating - $0.30 MWh • High end • Residential Ovens - $26/MWh • Residential Air Source Heat Pumps - $19/MWh
Environmental Externalities Value • Based on Carbon Dioxide Emissions from West Coast Power System • Consensus that $0 is wrong • Used $5- $40/ton of CO2 emitted • Varied amount and future date of carbon control implementation • Adds about $3/MWh to Present Value Benefit of Savings (also varies by shape of savings)
“Cost-Effectiveness” of Conservation Varies by Perspective Energy Star Clothes Washer (MEF 2.2) with Electric Water Heating and Electric Dryer • Present Value Capital Cost = $0.44/kWh • Value to Bulk Power System= $53/MWh (B/C = 1.17) • Value to Local Distribution System (includes bulk power system value)= $66/MWh (B/C = 1.47) • Value to Region/Society (includes detergent & water savings, plus carbon credit)= $123/MWh (B/C = 2.8)