Download

1 / 33
330 likes | 472 Views
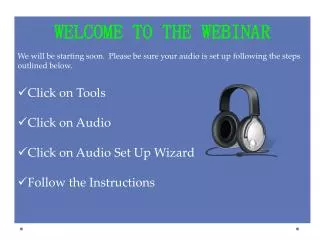
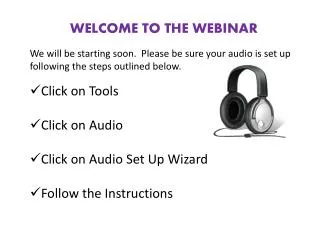
Welcome to the 2012 Research Residency Data webinar, hosted by Michèle Shuster, New Mexico State University! The Webinar will start promptly at 12:00pm EST . Enable your speakers Click on the dropdown arrow next to the speaker icon (top of screen)

E N D
Welcome to the 2012 Research Residency Data webinar, • hosted by Michèle Shuster, New Mexico State University! • The Webinar will start promptly at 12:00pm EST. • Enable your speakers • Click on the dropdown arrow next to the speaker icon (top of screen) • Click “Unmute my speakers.” Your speaker icon should turn green. • Adjust the presentation volume by clicking on the dropdown arrow next to the speaker icon and clicking “Adjust Speaker Volume.” • You will be able to communicate with Michèleand your fellow attendees by typing in the Chat box in the lower right-hand side of the screen. • Warm-up assignment • While we are waiting for everyone to join us, please visit the links in the “While you’re waiting” box! [For Food Safety- click “Enter” (below sink), then “Music” (top) then “Watch” (at right); Stomachache Tonight is a good one!] • For technical issues, please contact Lyndsey Van Druff • lvandruff@asmusa.org or 202-942-9322
Welcome back! • Did you enjoy the videos? • (use the “raise your hand” button at the top- drop down tab to agree/disagree)
Thanks for being here today • I know you don’t have microphone “privileges”, but do feel free to type any questions in the chat box at any time • And thanks for responding to the quick survey • Here are some of the “results”
Data Collected/ To Be Collected • Pilot data • Lots of pre-test data already collected • Some post-data collected • Some still needs to be collected • Post-test • Surveys • Great work!
I know we are asking you about your project/data… • What are YOUR goals? (this is your residency after all) • Use the poll feature to respond
A few points that came up • Confidential vs. anonymous vs. anonymized • Analysis of perceptions of learning vs. actual learning • Qualitative data
Confidential vs. Anonymous • Confidential • Collected in such a way that the subject COULD be identified • E.g. name on a pre-test to match with a post-test • E.g. voice/name/face on a recording of an interview/focus group • Can (try to) anonymize • Replace name with a code • Or a pseudonym (in transcripts of recordings)
Anonymized • Link • b/w actual identity and code/pseudonym • Consider if you need/want to keep it
Anonymous • Collected without any identifiers • No way to know the identity of any participants • If you are using an embedded instrument (something that students are doing in your course), it is probably not anonymous • Can do a “tear off” sheet at the back of an assignment (e.g. anonymous survey that gets physically removed from an assignment)
Quantitative • Lots of pre-tests and post-tests • How to score/record? • Item-by-item • vs. overall (total) score? • Depends on what you want to know • Some surveys • Set up with pre-designed subscales • Items designed to look for internal consistency need to be recorded individually
When in Doubt • Better to do finer scale scoring and entering • Item-by-item • Or category-by-category (e.g. a subscore for a particular topic) • You can always combine later
What to report? • N, means, stddev • And an analysis of pre and post means • There are arguments and reasons to report BOTH • an absolute gain • and a normalized gain • Raise your hand if you know what ONE of these is
What to report? • N, means, stddev • And an analysis of pre and post means • There are arguments and reasons to report BOTH • an absolute gain • and a normalized gain • Raise your hand if you know what ONE of these is • Anyone know BOTH?
What to report? • N, means, stddev • And an analysis of pre and post means • There are arguments and reasons to report BOTH • an absolute gain • and a normalized gain • Raise your hand if you know what ONE of these is • Anyone know BOTH? • Anyone want to type one or the other in chat?
Gains • Absolute • Post-pre • Normalized • [(Post-pre)/(max-pre)]
One question that came up • How to compare student perceptions of learning (collected as Likert data) with their actual learning (pre and post tests)? • Good question!
From one article…. • “Student perceptions of their learning have been found to be highly correlated with scores on achievement tests (Cohen, 1981; 1986; Marsh, 1987; Feldman, 1989; Seymour et al, 2000). • So maybe check out thoserefs From Moody and Sindre, Evaluating the Effectiveness of Learning Interventions
On the other hand… • “While previous researchers have suggested that measures of perceived learning are an adequate substitute for measures of actual learning outcomes (Rovai, 2001a, 2001b), the results of this study suggest the need to examine this practice more closely” http://ausweb.scu.edu.au/aw04/papers/refereed/ertmer/paper.html
Cont’d • “…….Neither did we find significant relationships between our measure of perceived learning and our two measures of learning. “ • From Ertmer and Stepich, 2004 http://ausweb.scu.edu.au/aw04/papers/refereed/ertmer/paper.html
What they did • Students perceptions of competencies • 16 competencies: rate as 1(weak)- 5 (strong) for each • Pre and post • -> then calculated a gain score as measure of perceived learning • But then didn’t actually correlate with their measures of learning • Alignment…. • But maybe the idea of a gain score for a 5-point scale is useful?
And from Pollack (no date) Pollack “No Single Cause: Learning Gains, Student Attitudes, and the Impacts of Multiple Effective Reforms”
So then I asked Jim…Here is what he thought • 1. Treat both the Likert data and the learning data as continuous • Test for a correlation • 2. Define categories • E.g. Likert Low, Likert High, Learning Low, Learning High • Do a chi-squared test of association • Questions? • Ask Jim! ;)
And for Qual • Are you using a rubric? • Many of you are developing one • Do you want to pilot it with a set of raters? • Do other experts agree with your rubric? (expert validity) • Plan for multiple scorers? • Plan for inter-rater reliability? • Are you coding for themes? • Do you have other coders? • Do you have a plan for reconciling?
A Qual question that came up • “How do you estimate the time needed to code survey responses per person and to transcribe recorded interviews?” • Great Question!
Here is what Christine says • For a one-hour taped interview • ~ 3-4 hrs to transcribe • ~ 3 hrs to code (if generating codebook at same time/ deductive) • Faster to code if you already have the codebook • Also depends on your technology • Post-its and highlighters will take longer • Cutting & pasting in Excel works • Qual anal software work best & fastest (Nvivo and Atlas.ti)
ASM CUE Abstract Deadline • When is it? (poll)
ASM CUE Abstract Deadline • Don’t panic • Just focus • You don’t need to have ALL your data analyzed • But you do need at least some data that has been analyzed • So (if you need to) go for just ONE thing
ASM CUE • ONE THING • And hit it hard • One question/theme • E.g. have you identified a specific problem in graph interpretation? • OK- report on that (with data!) • E.g. Do you have pre/post and are waiting on course evals/surveys? • OK- report on pre/post data
ASM CUE • Based on the criteria • Need a QUESTION (SCIENTIFIC PROBLEM) • Can be smaller/more specific than your entire (career-building) ASM RR question • A METHOD to test the HYPOTHESIS • How did you collect data/what was your intervention/ is there ALIGNMENT? • A DATA set • That can lead to a CONCLUSION re. your question • Based on data and its analysis
ASM CUE • And of course… • Read the information/criteria • http://www.asmcue.org/page05a.shtml
Any Questions? • No guarantees that I will have an answer….
If no more questions • Have a microbiologically safe American Thanksgiving! • What temperature (in degrees F) should you cook your turkey to? • (last poll)