Download
1 / 17
170 likes | 375 Views
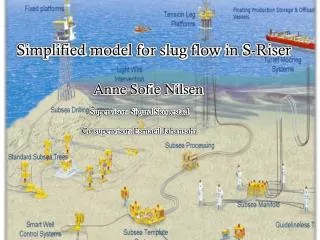
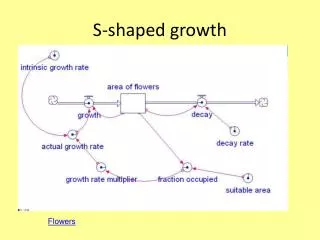
Slug flow in S-shaped risers . Studies on slug flow in S-risers: LedaFlow simulations and experiments. Mahnaz Esmaeilpour. Supervisor: Sigurd Skogestad Co-supervisor: Esmaeil Jahansahi. Overview. 1- Introduction

E N D
Slug flow in S-shaped risers Studies on slug flow in S-risers: LedaFlow simulations and experiments MahnazEsmaeilpour Supervisor: Sigurd Skogestad Co-supervisor: EsmaeilJahansahi
Overview 1- Introduction 2- Experiments3- LedaFlowSimulations4- ComparingSimulations and Experiments
1. IntroductionSlug flow in S-shaped risers 4 different flow regimes Stable flowTransitional flow (TTS) Severe Slugging II Severe Slugging I (SSI)
2. Experiments Setup Sensors Pressure sensors Acoustic sensor
2. Experiments (contd) • Step change test in stable region • Series of tests with different Usl’s and Usg’sto make related flow regime map • Series of tests with different valve positions to make the bifurcation diagram
2. Experiments (contd)Step change test in stable region Usl = 0.2 [m/s] Usg= 1 [m/s]
2. Experiments (contd) Step change test in stable regionFFT of acoustic signal
2. Experiments (contd) Flow regime map • 70 points of different gas & liquid superficial velocities • Choke valve was fully open (100 % of valve opening)
2. Experiments (contd) Bifurcation diagram Usl= 0.2 [m/s]Usg= 1 [m/s]
3. Simulations • Simulating slug flow in S-riser with LedaFlow • Make the same flow regime map as experimental one • Making the same bifurcation diagram as experimental one by changing valve position in different simulations with a fixed Usl and Usg
3. Simulations (contd)Simulating slug flow in S-riser with LedaFlow
3. Simulations (contd) Severe Slugging I (SSI)Usl=0.1 [m/s] Usg= 1 [m/s] Transfer region (TTS)Usl=0.1 [m/s] Usg= 4 [m/s] Stable regionUsl=0.2 [m/s] Usg=19 [m/s]
3. Simulations (contd) Flow regime mapbased on LedaFlow simulations
3. Simulations (contd) Bifurcation diagram Usl= 0.2 [m/s] Usg= 1 [m/s]