Gross Fixed Capital Formation
380 likes | 840 Views
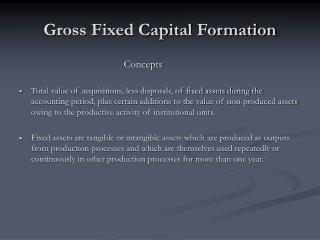
Gross Fixed Capital Formation . Concepts Total value of acquisitions, less disposals, of fixed assets during the accounting period, plus certain additions to the value of non-produced assets owing to the productive activity of institutional units.

Gross Fixed Capital Formation
E N D
Presentation Transcript
Gross Fixed Capital Formation Concepts • Total value of acquisitions, less disposals, of fixed assets during the accounting period, plus certain additions to the value of non-produced assets owing to the productive activity of institutional units. • Fixed assets are tangible or intangible assets which are produced as outputs from production processes and which are themselves used repeatedly or continuously in other production processes for more than one year.
Tangible Fixed Assets • Acquisitions, less disposals, of new and existing tangible fixed assets, sub-divided by type of asset into: • Dwellings; • Other buildings and structures; • Machinery and equipment; • Cultivated assets – trees and livestock - that are used repeatedly or continuously to obtain products such as fruit, rubber, milk, etc.
Intangible Fixed Assets • Aquisitions, less disposals of new or existing intangible fixed assets, sub-divided by type of asset into: • Mineral exploration; • Software; • Entertainment, literary or artistic originals; • Other intangible fixed assets.
Others • Major improvements to non-produced tangible assets, including land. • Costs of transfers of ownership of produced and non-produced assets.
Gross Fixed Capital FormationBusiness and Government • Three main categories: • Residential Construction • Non-Residential Construction • Machinery and Equipment
New Residential Construction • Singles, doubles, rows and apartments – (Work-put-in-place) • housing starts – Central Mortgage and Housing Corporation ( CMHC ) • average value of building permits – Building Permits Survey • work put in place coefficients
Other New Construction • Cottages, mobile homes and conversions • Building Permits Survey • Supplementary costs Goods and services Tax Provincial Sales Tax Land developer fees Other supplementary costs Data published on a monthly basis by Investment and Capital Stock Division ( ICSD)
Alterationsand Improvements • Included are all works that improve the quality of the dwelling and extend its service life e.g. - replacement of carpets - replacement of roof - installation of fixed electrical home appliances • Repair work is recorded in personal consumer expenditures under services.
Alterations and Improvements(Annual Estimates) • National and provincial annual estimates • Renovation expenditures undertaken by: Owner – occupants Landlords Cottage owners Renters • Survey of Household Spending –SHS • Homeowners Repairs and Renovations Survey - HRRS
FAMEX /SHS – Family Expenditure Survey or Survey of Household Spending HRRS – Homeowners Repair and Renovations Survey (discontinued in 2002) IEAD – SNA estimate
Alterations and Improvements (Quarterly Sources) • Building permits for renovations (source: ICSD ) • Sales of building materials such as • building supplies, • metal products, • lumber and millwork. ( source: Wholesale Trade Survey ) • And information for home furniture stores, home centres and hardware stores and other building material and garden equipment dealers. (source: Retail Trade Survey )
Ownership Transfer Costs • Annual sources of data: • Real Estate Agents and Brokers Survey • Multiple Listing Service – MLS • Survey of Household Spending – SHS • Quarterly source • Multiple Listing Service – MLS • the number of units sold and • the average sale price.
Deflation • New residential construction • New House Price Index – NHPI excluding land (Prices Division) • Single family dwellings • Semi-detached dwellings • Row houses • Apartment Building Construction Price Index • Apartments
Deflation • Alterations and Improvements: • Renovations Price Index (estimated in IEAD) • Cost of Labour ( 60% ) ( Survey of Employment, Payrolls and Hours) • Cost of Materials ( 40% ) ( Materials by type such as lumber, pipes, etc. ) • Transfer Costs • Indexed average selling price of existing homes sold from Multiple Listing Services (MLS)
Non-Residential Construction • New non-residential construction (work put in place) • Additions and major renovations • Conversions and alterations that extend the life of an existing asset • Transfer costs • Capitalized costs (architectural, legal and engineering fees and interest)
Business & Public Administrations • Two categories • Building construction e.g. hotels, office buildings, railway stations, schools and shopping centres • Engineering construction e.g. bridges, roads, highways, waterworks, sewage systems, airports, transmission lines, oil well drilling, mine development, railway tracks, etc.
Sources of Data Annual sources of data • Input/Output tables • Capital Expenditure Survey (CES), Actual, Preliminary and Intentions Estimates • Quarterly projectors and related indicators Quarterly sources of data • There is no quarterly survey. • Related indicators are used to measure non-residential construction for the current year.
Global Approach Total Construction Activity is obtained by combining data on: • Material costs (shipments - exports + imports + ∆ inventories) • + Labour costs (employment, hours and average earnings) • + Overhead costs and profits • = Total value of construction activity • - Estimates of residential construction (New Construction, A&I) • + Value added in oil and gas drilling • = Value of spending on non-residential construction
Non Residential Construction • Resulting estimates are compared with annual estimates from the Capital Expenditure Survey and the survey by asset type • Quarterly estimates are benchmarked during the annual revision cycle • Annual estimates reflect the most recent data from Input-Output tables
I. Buildings: Institutional, industrial and commercial non-residential construction (ICSD) based on monthly building permit values and monthly work put in place (WPIP) coefficients The monthly Building Permits Survey of Canadian municipalities collects data on the value of construction intentions for buildings in the non-residential sector and the number of dwellings authorized and value of construction projects in the residential sector. The WPIP coefficients measure, by quarter of start, by province and by type of building, the volume of work normally executed in each construction period. Detailed approaches
Detailed Approaches II. Engineering: • Highways: • Material costs based on asphalt sales in cubic metres * Industry Product Price Index (IPPI) for asphalt • Labour costs (SEPH) • Railways: • Material costs (e.g. ties, sand, stone, steel, etc.) • Labour costs (SEPH)
Detailed Approaches • Other engineering • Material costs • iron and steel pipes, other metal building products, wires and cables, concrete products, prefabricated metal structures, glass products, etc. • Labour costs based on estimates of • Hours • Average weekly earnings • Number of employees. • Information based on Labour Force Survey ( LFS ) and Survey of Employment, Payrolls and Hours ( SEPH )
Non Residential Construction • Other information used: • Construction estimates reported in the Quarterly Survey of Financial Statistics for Enterprises (large companies in mining, telecommunications, railways…etc.) • Capital spending by provincial electric utilities – Public Institutions Division • Cubic metres drilled in the oil and gas industry – Industry Accounts Division – Monthly GDP • Department of Natural Resources (general exploration expenditures )
DeflationBuildings • Non-Residential Building Construction Price Indexes (commercial, industrial and institutional) – Prices Division • The Non-residential Building Construction Price Index (NRBCPI) is a quarterly series measuring the changes in contractors' selling prices of non-residential building construction (i.e. commercial, industrial and institutional)
DeflationEngineering • In the absence of output price indexes – Input price indexes are constructed in IEAD: • Material costs: • IPPI for prefabricated metal building and structure, line pipe, other insulated wires and cables, concrete basic products, sand, stone, ready-mix concrete, etc. • Labour costs: • Average weekly earnings (SEPH) • Overhead costs: • Average weekly earnings indexes and consumer price indexes
Machinery and Equipment Spending on durable and tangible goods that have a productive life of one year or more (whether owned or leased) including: • purchase, construction and installation costs • feasibility studies, tooling, progress payments • exploration and development costs • net portion of used assets
Benchmark data are from the final demand matrix of the Input-Output tables (IOT). Current estimates are based on the Capital Expenditures Survey Actual, Preliminary and Intentions of Investment and Capital Stock Division and The sum of the quarterly estimates coming from a Supply Disposition approach. Sources of Data(Annual)
Sources of Data(Quarterly) • Supply / Disposition model: GFME = GO + M – X + change in inventories, where GO - gross output estimated using shipments M - imports from International Trade Division X - exports from International Trade Division • Done at a very detailed level (39 groups), such as for • Telecommunication equipment • Telephone and related equipment including facsimile • Broadcasting and radio communication equipment • Radar & radio navigation equipment ( Re. Supply/disposition models sent to the NBS on March 2007 )
Sources of Data(Quarterly) • Industrial machinery • Machine tools • Conveyors, elevators & hoisting machinery • Packaging and bottling machinery • Construction & mining machinery • Logging, pulp & paper industry machinery • Power generation & marine prop., non-electric • Electrical generators & motors
Sources of Data(Quarterly) • Other transportation equipment • Aircraft • Commercial trailers & semi-trailers • Truck & bus bodies & cargo containers • Locomotive, railway & urban trans. rolling stock • Ships, boats & parts, excl. pleasure • And other groups
Investment in Cars and Trucks • A more direct approach is used to estimate investment in cars and trucks: • Total sales by type from Survey of New Motor Vehicle Sales • Government and business shares based on data from Motor Vehicles Manufacturers Association.
Software Investment • Own account software • Pre-packaged software • Custom-design software • Own-account software ( software developed by in-house employees to meet specific organization needs ) is based on the labour costs of computer programmers and system analysts and other costs (non-salary) of in-house software development. • Investment in pre-packaged and custom-design software is estimated residually (domestic production, plus imports, plus margins, less exports, less personal expenditure).
Machinery and equipment price indexes (MEPIs) are used for all commodities except computers and software. The MEPI tracks price movements on a domestic and imported basis (producer price indexes published by the U.S. Bureau of Labor Statistics are used for the import component). The Machinery and Equipment Price Index (MEPI) provides quarterly estimates of price changes for machinery and equipment purchases, relative to annual gross additions to capital by Canadian Industry of purchase. Deflation
Deflation • The deflator for computers is a weighted average of import and export computer price indexes. • Own-account software is deflated using a fixed weighted average of hourly earnings of programmers and systems analysts and an index of costs of non-labour inputs. • The Commercial Software Price Index from Prices Division is used to deflate pre-packaged software. • Custom-design software is deflated using a weighted average of the pre-packaged and own-account price indexes.