Download
1 / 21
210 likes | 420 Views
University of Waikato Friday 13 April 2012 . Immigrant Integration and Social Capital Formation. Matthew Roskruge, Arthur Grimes, Philip McCann, Jacques Poot. Funded by International Integration of Immigrants Programme and Motu Economic Public Policy and Research. Motivation.

E N D
University of Waikato Friday 13 April 2012. Immigrant Integration and Social Capital Formation. Matthew Roskruge, Arthur Grimes, Philip McCann, Jacques Poot. Funded by International Integration of Immigrants Programme and Motu Economic Public Policy and Research
Motivation • Social capital is related to a range of positive (and some negative) economic and social outcomes. • Growth, Efficiency, Social cohesion, Wellbeing. • Migration separates people from their location specific social capital, creating an incentive to invest in new networks in host country. • Benefits migrant. • Benefits existing migrant groups. • Benefits non-migrant groups. • May benefit society as a whole. • Strategies migrants use to invest in social capital may depend on the demography, culture and language of the migrant as well as spatial factors of the region they live in. © THE UNIVERSITY OF WAIKATO • TE WHARE WANANGA O WAIKATO
Motivation (cont.) • Only a handful of studies examining social capital amongst migrants internationally, primarily by educational sociologists • No study conducted using New Zealand data. • Understanding migrant investments in social capital will aid in policy formation and contribute to further work on social capital. • This presentation aims to answer the following questions • Do migrants use social capital investment as a form of integration? • Is there any difference between foreign born and native born investment in social capital? • Does investment in social capital impact the economic and wellbeing outcomes for migrants? © THE UNIVERSITY OF WAIKATO • TE WHARE WANANGA O WAIKATO
Research Questions. • Do migrants use social capital investment as a form of integration? • Is there any difference between foreign born and native born investment in social capital? • Does region of birth play a role in social capital formation for migrants? • What role does geography and clustering play in social capital formation? © THE UNIVERSITY OF WAIKATO • TE WHARE WANANGA O WAIKATO
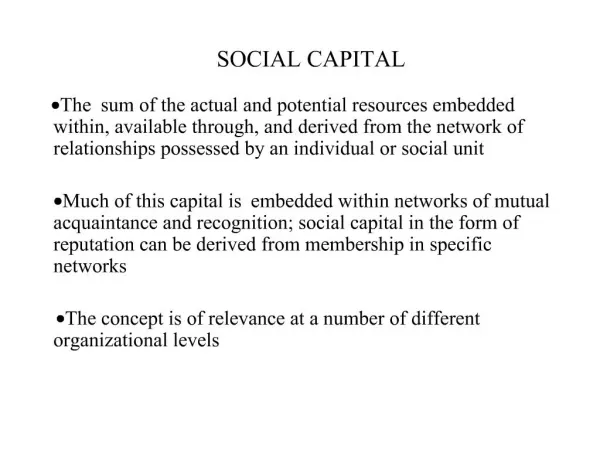
Measures of social capital “Social networks which are created, maintained and used by the network participants in order to distribute norms, values, preferences, information and social attributes”. -Westlund (2006). • Social capital can be indirectly measured using a range of proxy variables which are related to network formation or characteristics. • We utilize two proxies for social capital appropriate for developed democratic societies: • Participation in social activities. • Volunteering in community activities. © THE UNIVERSITY OF WAIKATO • TE WHARE WANANGA O WAIKATO
Analytical framework Four groupings of determinants of social capital formed the base for the framework: • Personal characteristics applicable to all individuals (Pi) • Personal characteristics applicable to foreign born only (Pfor) • Human capital (KHi) • Geographic and location specific variables (Gr) KSir = (Pi, Pfor, KHi, Gr,) Tobit regression methods then used to predict the impact of these factors on social capital formation amongst migrants. © THE UNIVERSITY OF WAIKATO • TE WHARE WANANGA O WAIKATO
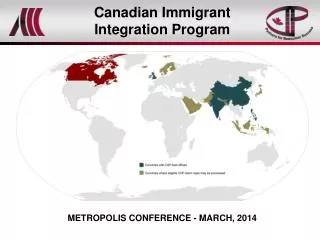
Data • Data sourced from the 2006 Adult Literacy and Life Skills survey (ALL). • For NZ, participants were drawn at random from electoral role, collection via face to face in-home interviews. • Survey conducted in 12 countries, with questions relating to: Education, Work, Health and wellbeing, Literacy, numeracy and computing skills and Social participation. • Variables of interest selected from ALL survey using the framework specified earlier. © THE UNIVERSITY OF WAIKATO • TE WHARE WANANGA O WAIKATO
Data (cont) • Variables of interest selected from ALL survey using the framework specified earlier. • Final sample after merging and cleaning included 6819 observations, with 1694 (24.8%) foreign born individuals. • Regional data was sourced through Statistics New Zealand, primarily the 2006 census. • Data allowed for the construction of the two measures of social capital, along with detailed determinants and regional indicators for density, clustering between regions and clustering within a region. © THE UNIVERSITY OF WAIKATO • TE WHARE WANANGA O WAIKATO
Migrant characteristics © THE UNIVERSITY OF WAIKATO • TE WHARE WANANGA O WAIKATO
Regional effects As some social capital is location specific, it is important to consider the role of spatial factors in influencing investment. Geography could influence both the amount of investment and the form of investment (bridging v bonding) through two mechanisms. • Population density. • Migrant clustering. • Between regions • Within a region © THE UNIVERSITY OF WAIKATO • TE WHARE WANANGA O WAIKATO
Regional data • Regional data is coded for individuals at the at the territorial authority level using 2006 NZ census data. • Population density. • Clustering between TA’s. (Lichtenberg index) • Clustering within TA’s (Duncan segregation index) © THE UNIVERSITY OF WAIKATO • TE WHARE WANANGA O WAIKATO
Regional characteristics. © THE UNIVERSITY OF WAIKATO • TE WHARE WANANGA O WAIKATO
Tobit results for Pooled Participation and Volunteer with regional effects. N=6818.
Discussion Migrants from the UK, US, Ireland and Australia • Similar to migrants from Cont. Europe and MELAA. • Strong evidence of catch-up effect. • Most influenced by regional characteristics. Pacific Island born migrants • most similar to NZ born. • Native born people who identify as Pasifika have highest participation and volunteering. • Small effect from regional variables. • Strong positive impact of age and education. Migrants from Asia • Strongest catch-up effect. • No evidence of geographical effects other than density. © THE UNIVERSITY OF WAIKATO • TE WHARE WANANGA O WAIKATO
Lifecycle model of social capital investment • YSM, education and age results all suggest that a lifecycle model of understanding social capital investment amongst migrants is appropriate • Migrants invest in social capital on arrival. • After approximately 15 years migrants appear to assimilate, reduce Ks investment • Investment increases again as migrants near retirement.
Discussion (cont.) • Education is especially important, particularly amongst Pacific Island migrants. • Age appears to be slightly more important for migrants compared to Native born individuals. • Gender does not impact investment by migrants, but strongly determines investment amongst native born. • Effects of geography less evident • Increasing Population density of a territorial authority may weakly decrease investment in social capital. • Regions with higher proportions of migrants appear to invest less in social capital. • More segregated regions experience higher investment in social capital © THE UNIVERSITY OF WAIKATO • TE WHARE WANANGA O WAIKATO
Conclusions. • Migrants enter New Zealand with low or no local fixed social capital. • Asian & Continental European migrants have lowest initial stocks. • Results for YSM suggest investment in social capital for migrants follows a lifecycle model. • Complex relationship exists between geography and migrant investment in KS. • Clustering between regions adversely impacts English speaking and pacific groups, positively impacts investment by Asian groups • Clustering within regions has weak positive role in social capital investment. © THE UNIVERSITY OF WAIKATO • TE WHARE WANANGA O WAIKATO
Furtherinvestigation • Alternate measures of social capital. • Deeper understanding of regional framework. • Further develop understanding of investment ‘bridging’ or ‘bonding’ Ks. • Outcomes of social capital investment by migrants. © THE UNIVERSITY OF WAIKATO • TE WHARE WANANGA O WAIKATO
Web links ALL: http://www.educationcounts.govt.nz/topics/research/all IIP: http://newsettlers.massey.ac.nz/ Motu: http://www.motu.org.nz/ Waikato: http://www.waikato.ac.nz © THE UNIVERSITY OF WAIKATO • TE WHARE WANANGA O WAIKATO