Download
1 / 25
350 likes | 1.12k Views
Geographic Information Systems (GIS). Dr. Roy Cole Department of geography and Planning GVSU. What is a geographic information system?. A computer system designed for storing, manipulating, analyzing, and displaying data in a geographic context.

E N D
Geographic Information Systems (GIS) Dr. Roy Cole Department of geography and Planning GVSU
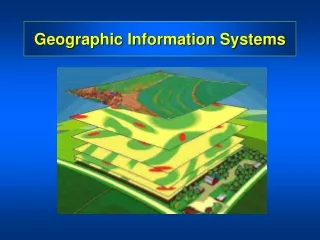
What is a geographic information system? • A computer system designed for storing, manipulating, analyzing, and displaying data in a geographic context. • a computer system designed to allow users to collect, manage and analyze large volumes of spatially referenced information and associated attribute data. • Analysis that combine relational databases with spatial interpretation and outputs often in form of maps. • A GIS represents within a computer real-world geographic relationships and allows them to be analyzed and modeled.
Topology is at the heart of GIS analysis • The geometric characteristics of objects which do not change under transformations (stretching or bending) and are independent of any coordinate system. • The topological characteristics of an object are also independent of scale of measurement. • Topology as it relates to spatial data consists of three elements: • Adjacency. • Containment. • Connectivity. • In GIS, distance, area, volume can be measured. • Almost anything can be mapped.
Questions that can be answered with a GIS • What is there? • How much is there? • Why isn’t it elsewhere? • Was it there in the past? • Will it be there in the future?
GIS research can be basic or applied • Basic research. • Modeling land use change. • Spread of a disease through a population. • Impact of global climate change on agriculture. • Determining an endangered species’ habitat. • The ideal location of health centers to equally provide service to all people in a country or region. • Modeling urban growth. • Previous geographic states: pre-crustal (isostatic) rebound Michigan.
GIS research can be basic or applied • Applied research. • Environmental protection/restoration. • Pollution mapping and modeling. • Crime mapping. • Natural resource management. • Power allocation by utilities companies. • Most efficient routing for vehicles. • Marketing areas. • Surveillance of disease outbreak and spread. • Planning urban growth. • Facilities (gas lines, fire hydrants, etc.) management. • County and city property taxation.
Two principal types of GIS, raster and vector • Raster GIS. • Raster representations divide the world into arrays of cells. • Geographic unit of raster GIS. • The cell (pixel). • A unique reference coordinate represents each pixel either at a corner or the centroid. • Attributes (variables) are assigned to the cells.
Two principal types of GIS, raster and vector • Vector GIS. • Displays and defines features on the basis of two-dimensional Cartesian coordinate pairs (x and y) and computational algorithms of the coordinates. • Geographic elements in vector GIS: • Point = node. • Line = vertex or arc. • Area = polygon. • Each element can be given attributes. • Location. • Adjacency. • Variables.
Two types of GIS data, attribute and spatial • Attribute data. • A characteristic of a feature that contains a measurement or value for the feature. • The variable being measured. • An item for which data are collected and organized. • Labels. • Categories. • Numbers. • Dates. • Standardized values. • Field or other measurements. • Can be at any level of measurement. • Nominal. • Ordinal. • Interval/ratio.
Two types of GIS data, attribute and spatial • Spatial data. • Geographical location. • Where the variable being measured is located. • Points. • Lines. • Polygons. • Pixels.
Examples • How many people live within 10 miles of a superfund site in Michigan? • Sales by market region by sales agent. • Population change in any state over time. • Spread of soybean cultivation across the United States. • What is the best place to site the Grand Haven bypass? • Prolonged drought and land use change over a 33-year period in central Mali, West Africa. • Does living next to light rail public transportation increase the value of property? • Where are the pediatricians who are chosen by women who give birth at North Ottawa Community Hospital located: Grand Haven or elsewhere?
Mapping land use/cover change along Lake Michigan in Grand Haven Township, 1973 to 2004
Mapping land use/cover change along Lake Michigan in Grand Haven Township, 1973 to 2004
Mapping crime • Identifying priority neighborhoods (Vulnerable Localities Index). • Geographical indicators of community cohesion. • Crime hotspots. • Profiling hot spots. • Predicting patterns of criminal activity.
Crime mapping, Tifton, Georgia • Beginning in 2004, the South Georgia Regional Development Center began geocoding crime incidents for Tifton, Georgia (population 15,000). • Officials wanted to see how the crime patterns would look. • Initially, a density map for all Part I crimes for the period of February 2004–April 2004 was made. • After that, crimes were broken down by six-hour time periods (midnight to 6:00 a.m., 6:00 a.m. to noon, noon to 6:00 p.m., 6:00 p.m. to midnight) to see how density patterns would vary by time of day. • Analyzing crime incidents by time of day helps law enforcement concentrate patrol efforts during specific time periods.