Download

1 / 14
140 likes | 298 Views
Studying the Process of Science Using MY NASA DATA. Becoming Familiar with MY NASA DATA. TEACHER RESOURCE PAGES. Getting Started. Educators Landing Page / Middle School Teachers Page http://mynasadata.larc.nasa.gov/educators/

E N D
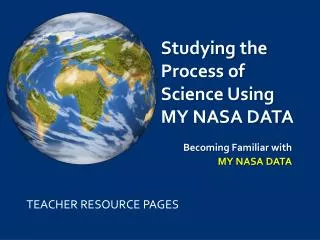
Studying the Process of Science Using MY NASA DATA Becoming Familiar with MY NASA DATA TEACHER RESOURCE PAGES
Getting Started • Educators Landing Page / Middle School Teachers Pagehttp://mynasadata.larc.nasa.gov/educators/ • Using My NASA Data (Includes links to tutorials, videos, etc)http://mynasadata.larc.nasa.gov/using-my-nasa-data/ • Live Access Server: http://mynasadata.larc.nasa.gov/live-access-server/ • Meet the Team: http://mynasadata.larc.nasa.gov/my-nasa-data-team/
National Science Standards Addressed • Science as Inquiry - Science as inquiry requires students to combine processes and scientific knowledge with scientific reasoning and critical thinking to develop their understanding of science. • Earth and Space Science - Earth and space science focuses on science facts, concepts, principles, theories, and models that are important for all students to know, understand, and use. • Science and Technology - An understanding of science and technology establishes connections between the natural and designed world, linking science and technology. • Science in Personal and Social Perspectives - A personal and social perceive of science helps a student to understand and act on personal and social issues. This perspective builds a foundation for future decision making. • Unifying Concepts and Processes - Unifying concepts and processes help students think about and integrate a range of basic ideas which builds an understanding of the natural world.
Virginia Science Standards (4-9) Addressed • 4.1 The student will plan and conduct investigations in which data are collected, recorded, analyzed, and displayed using bar and line graphs and predictions, inferences are made, and conclusions are drawn based on data from a variety of sources. • 5.1 The student will plan and conduct investigations in which data are collected, recorded and reported using the appropriate graphical representation (graphs, charts, diagrams); predictions are made using patterns, and simple graphical data are extrapolated. • 6.1 The student will plan and conduct investigations in which data are collected, recorded, analyzed, and reported using appropriate metric measurement; data are organized and communicated through graphical representation (graphs, charts, and diagrams). • 6.2 The student will demonstrate scientific reasoning and logic. Key concepts include ideas are investigated by asking for and actively seeking information and conclusions are based on scientific evidence obtained from a variety of sources. • 6.3 The student will investigate and understand the role of solar energy in driving most natural processes within the atmosphere, the hydrosphere, and on Earth’s surface as it relates to the Earth’s energy budget.
Virginia Earth Science Standards Addressed • ES.1 The student will plan and conduct investigations in which technologies, including computers, are used to collect, analyze, and report data and to demonstrate concepts and simulate experimental conditions; scales, diagrams, maps, charts, graphs, tables, and profiles are constructed and interpreted; and a scientific viewpoint is constructed and defended. • ES.2 The student will demonstrate scientific reasoning and logic by analyzing how science explains and predicts the interactions and dynamics of complex Earth systems; recognizing that evidence is required to evaluate hypotheses and explanations; explaining that observation and logic are essential for reaching a conclusion. • ES.3 The student will investigate and understand how to read and interpret maps, globes, models, charts, and imagery. • ES.11 The student will investigate and understand that oceans are complex, interactive physical, chemical, and biological systems and are subject to long-and short-term variations; systems interactions (energy transfer, weather, and climate). • ES.12 The student will investigate and understand the interrelationships of geologic processes, biological processes, and human activities on its composition and dynamics; including scientific evidence for atmospheric changes over geologic time; atmospheric regulation mechanisms; and potential atmospheric compositional changes due to human, biologic, and geologic activity. • ES.13 The student will investigate and understand that energy transfer between the sun, Earth, and the Earth’s atmosphere drives weather and climate on Earth; observation and collection of weather data; prediction of weather patterns; and weather phenomena and the factors that affect climate.
Virginia Math Standards (4-9) Addressed • 4.14 The student will collect, organize, display and interpret data from a variety of graphs. • 5.15 The student, given a problem situation, will collect, organize, and interpret data in a variety of forms. • 7.12 The student will represent relationships with tables, graphs, rules and words. • 8.13 The student will make comparisons, predictions, and inferences, using information displayed in graphs.
Virginia English Standards (4-9) Addressed • 4.1 The student will use effective oral communication skills in a variety of settings. • 4.2 The student will make and listen to oral presentations and reports. • 4.6 The student will demonstrate comprehension of information resources to research a topic; evaluating and synthesizing information. • 5.1 The student will listen, draw conclusions, and share responses in subject-related group learning activities. • 5.3 The student will make planned oral presentations. • 5.7 The student will demonstrate comprehension of information from a variety of print resources organizing information in charts, maps and graphs. • 6.2 The student will listen critically and express opinions in oral presentations. • 7.1 The student will give and seek information in conversations, in group discussions, and in oral presentations. • 8.2 The learner will develop and deliver oral presentations in groups and individually. • 9.2 The student will make planned oral presentations.
Virginia Computer/Technology Standards Addressed • C/T 3-5.6 The student will use technology to locate, evaluate, and collect information from a variety of sources; entering data into databases and spreadsheets. • C/T 3-5.7 The student will use technology resources for solving problems and making informed decisions. • C/T 6-8.6 The student will use technology to locate, evaluate, and collect information from a variety of sources; using databases and spreadsheets to evaluate information. • C/T 6-8.8 The student will use technology resources for solving problems and making informed decisions.
Possible Strategies to Incorporate • Encourage students to use a scientist notebook to record their research notes as they complete the tasks contained within the Web Quest. • The MY NASA DATA Web Quest can be teacher-guided to promote guided inquiry or used as a stand-alone inquiry based activity. • The MY NASA DATA Web Quest can be used to cover data collection standards and science process skills; as well as, weather investigation standards. • The MY NASA DATA Access Server has three levels of difficulty (basic, intermediate, and advanced) allowing for differentiation of instruction. These levels should be examined prior to conducting the activity to determine at what level each student might be most successful. • Another possible strategy might be to form cooperative learning groups with a diversified set of learning styles and/or learning stages. • Coordinating Lesson Plans can be implemented as stand-alone lessons, as guided inquiry-based prompts or in combination with the development of the Web Quest as student-directed research. • Presentations can be implemented at teacher discretion to allow students to communicate their results.
Coordinating Lesson Plans MY NASA DATA Lesson Plans: http://mynasadata.larc.nasa.gov/my-nasa-data-lesson-plans/ • Comparing Graphs of Temperature and Radiation (6-8) Purpose: students analyze plots of temperature and radiation data to determine change over time. • How does the Earth’s Energy Budget Relate to Polar Ice? (5-7) Purpose: students use satellite data to understand how the net flux of the radiation budget relates to the amount of ice present in the Northern Hemisphere. • Is Grandpa Right, Were Winters Colder When He Was a Boy? (6-8) Purpose: students use historic weather information and compare with current data to determine if there is significant temperature change. • Is Portland, Oregon Experiencing Global Warming? (6-9) Purpose: students use long wave radiation data to determine whether the climate has changed in Portland, Oregon over the past 20 years. • Sea Surface Temperature Trends of the Gulf Stream (6-12) Purpose: students use authentic satellite data to explore the seasonal changes in sea surface temperature of the Gulf Stream. • Snow Cover by Latitude (6-8) Purpose: using data sets from MY NASA DATA, students create graphs comparing the percentage of snow cover along selected latitudes by date.
Coordinating Lesson Plans Continued • Comparing Temperature and Solar Radiation for Common Latitudes (6-8) Purpose: students use NASA satellite data to examine the solar radiation received at same latitude locations compared to the surface temperature of each location. • March of the Polar Bears: Global Change, Sea Ice, and Wildlife Migration (7-12) Purpose: students will use NASA satellite data to study temperature and snow-ice coverage in the South Beaufort Sea, Alaska. • Evidence of Change Near the Arctic Circle (8-12) Purpose: students analyze graphs as evidence and make a conclusion about polar climate change. • Ocean Currents and Sea Surface Temperatures (8-12) Purpose: students examine data to discover the link between ocean temperatures and currents as related to concern for current climate change. • Studying Snow and Ice Changes (9-12) Purpose: students examine how snow and ice cover have changed on the Earth from 1994 to 2004, and practice using some of the data analysis tools available at MY NASA DATA. • Trends of Snow Cover and Temperature in Alaska (9-12) Purpose: students compare NASA satellite data observations with student surface measurements of snow cover and temperature.
Extension Questions • How is climate affected by the tilt of the earth? • What is remote sensing and how do scientists use it to help us understand our world? • What are the sources of the data that are located on the MY NASA DATA site? • What is happening to the levels of CO2 in our atmosphere? . . . to the Arctic Sea Ice?. . . to the land ice? . . . to sea level? . . . to glaciers? . . . to global temperature? . . . to ocean water temperature? • What is happening to the coral reefs in our ocean waters?
Additional Resource Links • National Center for Science Education Climate Change Educationhttp://ncse.com/climate • NICE: NASA Innovations in Climate Educationhttps://nice.larc.nasa.gov/ • NOAA Researchwww.research.noaa.gov/climate/ • The NASA Science Directorate EPO Blog: Observe Your Worldhttp://mynasadata.larc.nasa.gov/oyw/