Download
1 / 5
50 likes | 218 Views
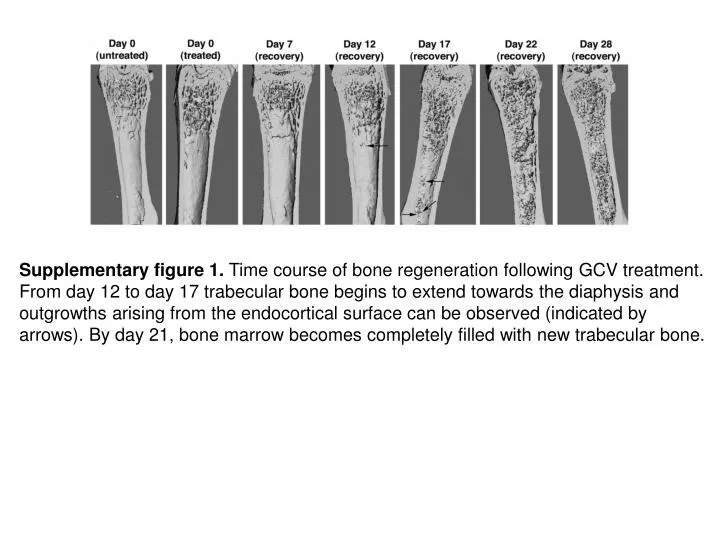
Supplementary figure 1. Time course of bone regeneration following GCV treatment. From day 12 to day 17 trabecular bone begins to extend towards the diaphysis and outgrowths arising from the endocortical surface can be observed (indicated by

E N D
Supplementary figure 1. Time course of bone regeneration following GCV treatment. From day 12 to day 17 trabecular bone begins to extend towards the diaphysis and outgrowths arising from the endocortical surface can be observed (indicated by arrows). By day 21, bone marrow becomes completely filled with new trabecular bone.
Supplementary figure 2. Detection of α-SMA using immunostaining (a–f) during process of bone recovery from GCV treatment, and hematoxylin staining to indicate bone tissue (g–l). α-SMA expression is restricted to cells associated with capillaries in untreated bones. Following treatment (b,h, day 0 of recovery) α-SMAGFP cells were detected in bone marrow in proximity to the endocortical surface, while at day 7 they were distributed throughout the bone marrow (c,i). Evidence of new bone formation concomitant with the disappearance of the α-SMA expression occurred between day 12 (d,j) and day 17 (e,k; areas of new bone are indicated by the arrows). After the recovery phase was completed by day 27 (f,l) bone marrow was filled with newly formed trabecular bone.
Supplementary figure 3. Colocalization of αSMAGFP(green) with endogenous αSMA expression in calcified tissues (Cy3 conjugated antibody, red). Images were taken utilizing monochrome camera and appropriate filters for GFP (excitation 500/20, emission 535/30) and red (excitation 545/30, emission 620/60), and images were then pseudocolored and overlayed as a composite image. HE staining of the same section was completed to indicate tissue localization. In 5-day and 5-week old sutures, αSMAGFP is active in periosteum and in cells associated with capillaries (see arrows). Osteoblast lining the bone marrow spaces were negative for GFP (arrowhead). Dura mater was the only source of tissue in which we have detected αSMAGFP without the signal from endogenous αSMA. In long bones, the expression of transgene and αSMA gene was restricted to microvessels within cortical bone and to the periosteal layer.
Supplementary figure 5. Localizing αSMAGFP to perivascular area. Images were taken epifluorescnece (left panel) and brightfield for immunohistochemical staining (right panel). GFP expression was localized on the outer layer blood vessels or capillaries lined with CD31 endothelial cells (see arrows).
Supplementary figure 5. Localizing αSMAGFP to perivascular area. Images were taken epifluorescnece (left panel) and brightfield for immunohistochemical staining (right panel). GFP expression was localized on the outer layer blood vessels or capillaries lined with CD31 endothelial cells (see arrows).