Download
1 / 73
760 likes | 1.02k Views
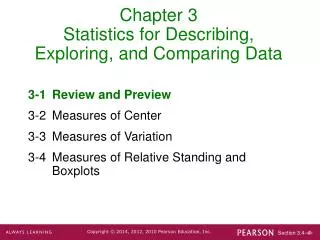
Chapter 3 Statistics for Describing, Exploring, and Comparing Data. 3-1 Review and Preview 3-2 Measures of Center 3-3 Measures of Variation 3-4 Measures of Relative Standing and Boxplots. 3.2- Measure of Center. Measure of Center the value at the center or middle of a data set.

E N D
Chapter 3Statistics for Describing, Exploring, and Comparing Data 3-1 Review and Preview 3-2 Measures of Center 3-3 Measures of Variation 3-4 Measures of Relative Standing and Boxplots
3.2- Measure of Center • Measure of Center • the value at the center or middle of a data set
1) Arithmetic Mean • Arithmetic Mean (Mean) • the measure of center obtained by adding the values and dividing the total by the number of values • What most people call an average.
Notation denotes the sum of a set of values. is the variable usually used to represent the individual data values. represents the number of data values in a sample. represents the number of data values in a population.
is pronounced ‘mu’ and denotes themean of all values in a population Notation is pronounced ‘x-bar’ and denotes the mean of a set of sample values
AdvantagesIs relatively reliable, means of samples drawn from the same population don’t vary as much as other measures of centerTakes every data value into account • DisadvantageIs sensitive to every data value, one extreme value can affect it dramatically; is not a resistant measure of center
Median the middle value when the original data values are arranged in order of increasing (or decreasing) magnitude • often denoted by (pronounced ‘x-tilde’) • is not affected by an extreme value - is a resistant measure of the center 2) Median
Finding the Median First sort the values (arrange them in order), the follow one of these 1. If the number of data values is odd, the median is the number located in the exact middle of the list. 2. If the number of data values is even, the median is found by computing the mean of the two middle numbers.
raw: 5.40 1.10 0.42 0.73 0.48 1.10 0.42 0.48 0.73 1.10 1.10 5.40 (in order - even number of values – no exact middle shared by two numbers) 0.73 + 1.10 MEDIAN is 0.915 2 raw: 5.40 1.10 0.42 0.73 0.48 1.10 0.66 0.42 0.48 0.66 0.73 1.10 1.10 5.40 (in order - odd number of values) exact middle MEDIANis 0.73
Modethe value that occurs with the greatest frequency Data set can have one, more than one, or no mode 3) Mode Bimodal two data values occur with the same greatest frequency Multimodal more than two data values occur with the same greatest frequency No Mode no data value is repeated Mode is the only measure of central tendency that can be used with nominal data
Mode is 1.10 Bimodal - 27 & 55 No Mode Mode - Examples a. 5.40 1.10 0.42 0.73 0.48 1.10 b. 27 27 27 55 55 55 88 88 99 c. 1 2 3 6 7 8 9 10
Midrangethe value midway between the maximum and minimum values in the original data set maximum value + minimum value Midrange= 2 Definition
Sensitive to extremesbecause it uses only the maximum and minimum values, so rarely used Midrange • Redeeming Features (1) very easy to compute (2) reinforces that there are several ways to define the center (3) Avoids confusion with median
Carry one more decimal place than is present in the original set of values. Round-off Rule for Measures of Center
Assume that all sample values in each class are equal to the class midpoint. Mean from a Frequency Distribution
use class midpoint of classes for variable x Mean from a Frequency Distribution
Weighted Mean When data values are assigned different weights, we can compute a weighted mean.
Symmetric distribution of data is symmetric if the left half of its histogram is roughly a mirror image of its right half Skewed distribution of data is skewed if it is not symmetric and extends more to one side than the other Skewed and Symmetric
Skewed to the left (also called negatively skewed) have a longer left tail, mean and median are to the left of the mode Skewed to the right (also called positively skewed) have a longer right tail, mean and median are to the right of the mode Skewed Left or Right
Recap In this section we have discussed: • Types of measures of center Mean Median Mode • Mean from a frequency distribution • Weighted means • Best measures of center • Skewness
Definition Therangeof a set of data values is the difference between the maximum data value and the minimum data value. Range = (maximum value) – (minimum value) It is very sensitive to extreme values; therefore not as useful as other measures of variation.
Round-Off Rule for Measures of Variation When rounding the value of a measure of variation, carry one more decimal place than is present in the original set of data. Round only the final answer, not values in the middle of a calculation.
Definition Thestandard deviationof a set of sample values, denoted by s, is a measure of variation of values about the mean.
Standard Deviation - Important Properties • The standard deviation is a measure of variation of all values from the mean. • The value of the standard deviation s is usually positive. • The value of the standard deviation s can increase dramatically with the inclusion of one or more outliers (data values far away from all others). • The units of the standard deviation s are the same as the units of the original data values.
Comparing Variation inDifferent Samples It’s a good practice to compare two sample standard deviations only when the sample means are approximately the same. When comparing variation in samples with very different means, it is better to use the coefficient of variation, which is defined later in this section.
Population Standard Deviation This formula is similar to the previous formula, but instead, the population mean and population size are used.
Variance • The variance of a set of values is a measure of variation equal to the square of the standard deviation. • Sample variance: s2 - Square of the sample standard deviation s • Population variance: - Square of the population standard deviation
Unbiased Estimator The sample variance s2 is an unbiased estimator of the population variance , which means values of s2 tend to target the value of instead of systematically tending to overestimate or underestimate .
Variance - Notation s=sample standard deviation s2= sample variance =population standard deviation =population variance
Range Rule of Thumb is based on the principle that for many data sets, the vast majority (such as 95%) of sample values lie within two standard deviations of the mean.
= Minimum “usual” value (mean) – 2 (standard deviation) = Maximum “usual” value (mean) + 2 (standard deviation) Range Rule of Thumb for Interpreting a Known Value of the Standard Deviation Informally define usual values in a data set to be those that are typical and not too extreme. Find rough estimates of the minimum and maximum “usual” sample values as follows:
Range Rule of Thumb for Estimating a Value of theStandard Deviation s To roughly estimate the standard deviation from a collection of known sample data use where range = (maximum value) – (minimum value)
Properties of theStandard Deviation • Measures the variation among data values • Values close together have a small standard deviation, but values with much more variation have a larger standard deviation • Has the same units of measurement as the original data
Properties of theStandard Deviation • For many data sets, a value is unusual if it differs from the mean by more than two standard deviations • Compare standard deviations of two different data sets only if the they use the same scale and units, and they have means that are approximately the same
Empirical (or 68-95-99.7) Rule For data sets having a distribution that is approximately bell shaped, the following properties apply: • About 68% of all values fall within 1 standard deviation of the mean. • About 95% of all values fall within 2 standard deviations of the mean. • About 99.7% of all values fall within 3 standard deviations of the mean.
Chebyshev’s Theorem The proportion (or fraction) of any set of data lying within K standard deviations of the mean is always at least 1–1/K2, where K is any positive number greater than 1. • For K = 2, at least 3/4 (or 75%) of all values lie within 2 standard deviations of the mean. • For K = 3, at least 8/9 (or 89%) of all values lie within 3 standard deviations of the mean.
Rationale for using n – 1 versus n There are only n – 1 independent values. With a given mean, only n – 1 values can be freely assigned any number before the last value is determined. Dividing by n – 1 yields better results than dividing by n. It causes s2 to target whereas division by n causes s2 to underestimate .
Thecoefficient of variation(or CV) for a set of nonnegative sample or population data, expressed as a percent, describes the standard deviation relative to the mean. Sample Population Coefficient of Variation
Recap In this section we have looked at: • Range • Standard deviation of a sample and population • Variance of a sample and population • Range rule of thumb • Empirical distribution • Chebyshev’s theorem • Coefficient of variation (CV)
Basics of z Scores, Percentiles, Quartiles, and Boxplots 3.4
z Score(or standardized value) the number of standard deviations that a given valuexis above or below the mean Z score