Download
1 / 54
540 likes | 553 Views
Explore the microbial ecology in the top meter of the ocean and discover the importance of the surface ocean in the exchange of irradiance, momentum, and materials between the atmosphere and the ocean.

E N D
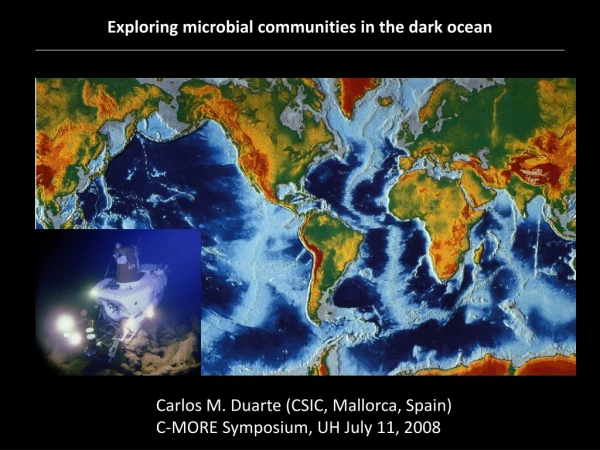
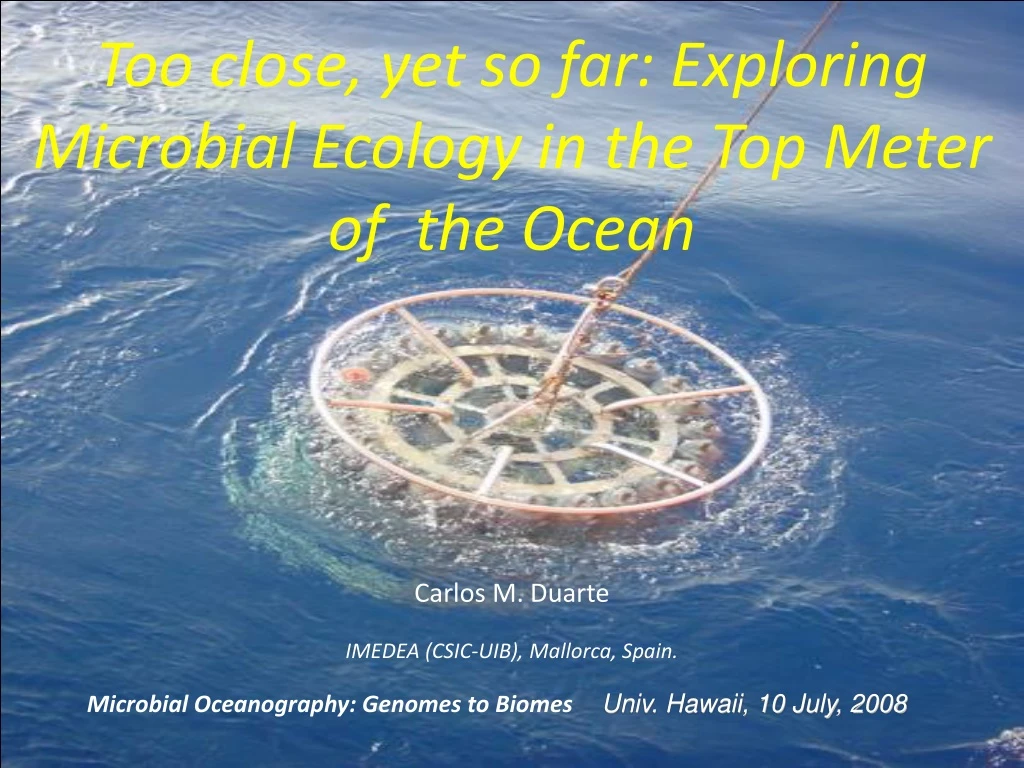
Too close, yet so far: Exploring Microbial Ecology in the Top Meter of the Ocean Carlos M. Duarte IMEDEA (CSIC-UIB), Mallorca, Spain. Microbial Oceanography: Genomes to BiomesUniv. Hawaii, 10 July, 2008
Two closely-coupled geophysical fluids Who, then, evolved the sea-blooms from the clouds Diffusing balm in that Pacific calm? C’était mon enfant, mon bijou, mon âme. Sea Surface Full of Clouds Wallace Stevens
The surface ocean The “skin” of the ocean, where contact with the atmosphere is effective: Interface for the exchange of irradiance, momentum and materials between atmosphere and ocean
Sampling Constraints The Rosette sampler system is a rather large instrument (2 m tall) and only performs well at depths > 3 m Along-way sampling systems are located in the hull of the vessel, typically at depths > 2 m Indeed, the very structure of the vessels disturbed the top m of the ocean
Global pCO2 data base (sampled at ~ 3 m depth): does this accurately characterize Surface pCO2?
The ocean surface Operational (sampling) definition: “The depth where Rosette systems and along-way pumps collect water form” ~ 3 - 5 m Is this appropriate? The ocean mixed layer is not constantly mixing: mixing times can span up to a week within the”mixed” layer: e.g. properties at 5 m ≠ 0.5 m
And the use of odd devices Sampling the ocean surface Sampling the top m of the ocean still requires going down in small boats
Some equipment (toys…) to sample surface waters… but only operational under very calm conditions Technologically, we remain in the 19th Century in terms of the instrumentation available to study the surface (top m) of the ocean
Oligotrophic and upwelling system in the Subtropical NE Atlantic Clha: 0.05 - 3.5 µg Chl a L-1 T: 16.1 - 26.8 - ºC pCO2w: 333 - 402 µatm Highly productive Antarctic waters : Clha: 0.6 - 4.6 µg Chl a L-1 T: -0.26 - 2.18 ºC pCO2w: 189 - 373 µatm STUDY SITES
Depth (m) pCO2 (ppm) High vertical variability within the top 5 m despite significant wind speed
North East Subtropical Atlantic Calleja et al. (in prep)
Southern Ocean Calleja et al. (in prep)
Mediterranean Sea Calleja et al. (in prep)
SO AO Enrichment of top cm in organic carbon
The ocean surface Operational (sampling) definition: “The depth where Rosette systems and along-way pumps collect water form” ~ 3 - 5 m Is this appropriate? • Top m’s of the ocean not well mixed for biogeochemicaly-relevant properties (e.g DOC, CO2). • Top m of the ocean not well mixed for microbial communities or processes. • Top cm’s of the ocean: sites of reception of dust and VOC inputs, site of gas exchange regulation. • Top cm’s of the ocean: metabolic hot-spots The ocean mixed layer is not constantly mixing: mixing times can span up to weeks within the”mixed” layer: e.g. properties at 5 m ≠ 0.5 m
2. • It is not physics… Is it Biology?
top cm top cm The metabolism of the community on the top centimeters of the water column is more intense than that at 5m depth Respiration Gross Primary Production Calleja et al. (2005)
∆pCO2= -12-1.7 (±0.1) NCP; R2= 0.99; P < 0.001 NCP top cm (µmol O2 L-1 d-1) net autotrophy net heterotrophy Metabolism at top centimeters of the ocean plays a disproportionate role in controlling air-sea CO2 disequilibria in subtropical waters Calleja et al. (2005)
pCO2 a ∆pCO2 = pCO2w - pCO2a Thermodynamic driving force of the Air-Sea CO2 flux. Respiration (R) Planktonic metabolism Is the Key biological process affecting pCO2w O2 + (CH2O)x pCO2 w Gross Primary Production (GPP) NCP = GPP- R A COUPLING BETWEEN AIR-WATER CO2 EXCHANGE AND PLANKTONIC METABOLISM
3. • It does matter.
The gas exchange coefficient increases with wind velocity, but with a lot of scatter Calleja et al. (submitted)
RK vs TOC RK (cm h-1) = 74.49 - 0.68 (± 0.13) TOC (µmol C L-1) R2= 0.85 P = 0.003 All observations RK (cm h-1) Mean values TOC top cm (µmol C L-1) The high TOC content of the upper cm’s of the ocean affect the gas exchange coefficient (K)
4. • Why is biology so active within the top m of the ocean?
Atmosphere Only CO2 exchanged! 90 88 Inorganic C GPP NPP 103 45 Biota Upper Ocean Aut. R 58 Het. R 34 33 42 11 Intermediate and deep water Het. R 11 OC DIC Intermediate & deep Ocean 0.01 CaCO3 cycling not shown IPCC 2001
The C Budget Ocean To organic C Heterotrophy is logically impossible if allochthonous organic C inputs = 0, the only possible outcome is that NCP > 0 Is this reasonable?
Are there atmospheric organic C inputs to the ocean? Atmospheric inputs Oceanic Rain water DOC: 59 ± 14 µmol C/L Aerosol have high organic C contents: 1.2 % to 37% OC The ocean is the major sink of Persistent Organic Pollutans (~proxy for atm. TOC) Jurado et al. (2004, 2005) If (aqueous equlibrium) [VOC]atm - [VOC]sea = 1 µmol C/L (concs. ~35 µmol C/L) then flux 5.5 Gt C/yr (Jurado et al. In prep)
Particulated Gaseous organic carbon Aerosol Organic C Atmospheric inputs Poorly known rates (not 1 direct estimate prior to 2005)
Composite satellite image of aerosols over the oceans The E Subtropical Atlantic is an area with very high aerosol load
Wet deposition of Organic C Global dry deposition of aerosol OC is estimated to be 11 Tg C y-1, wet-particle and wet-gaseous deposition are estimated 47 Tg C y-1 and 187 Tg C y-1 Jurado et al. (in press)
Exploring the biological impact Aerosol suspension 500 mL Aerosol collected on filter 200 100 50 25 12.5 6.25 BL1 BL2 Dilution Series (mL suspension added) + 2 controls (BL) 0.8µm filtered SW
Aerosol inputs greatly enhance planktonic metabolism (mostly microphytoplankton production) Duarte et al. (2006)
Exerimental aerosol additions estimulate the growth of specific bacteria groups consistently across experiments DGGE Increased Aerosol inputs Arrieta et al. (unpub)
Volatile organic carbon: Estimating the dissolved-equivalent concentration of atmospheric VOC in sea-water (VOCair/H’) and the VOCaq in surface waters. The differential ∆VOC = VOCaq - VOCair/H’ determines, along with wind velocity, the air-sea flux.
The surface ocean Intense deposition of organic carbon onto the surface ocean Dachs et al. (2005), Duarte et al. (2006)
Atmospheric inputs • Organic C inputs 15 fold > CO2 flux • Dominated by gaseous inputs (gaseous organic carbon 90 % of flux) • Atmospheric inputs to the Subtropical NE Atlantic 0.7 ± 0.2 Gt C/y vs. estimated organic C deficit (net heterotrophy) of 0.5 Gt C/y (Duarte et al. 2001) Dachs et al. (2005)
Composite satellite image of aerosols over the oceans More than 10 cruises compleated since
Fluxes into the ocean. • + Fluxes to the atmosphere. • The ∆DOC is large, supporting a large flux (to be calculated still) predominantely into the ocean
VOC flux 17.6 ± 9.7 AerosolOC flux 1.5 ± 0.3 R 70.7 ± 14 GPP 61.3 ± 14 Balanced! R zoo 5 POC flux 1.4 ± 0.3 DOC flux 3.3 ± 0.5 A Balanced C budget for the NE Subtropical Atlantic Missing = 19.1 Units = mmol C m-2 d-1 N = 9 stations
Particulated Gaseous organic carbon Aerosol Organic C Atmospheric inputs What is the fate of the VOC flux?
VOC utilization • Atmospheric VOC fluxes dominate the air-sea exchange of organic carbon the NE Subtropical Atlantic. Dachs, J. and others 2005. High atmosphere-ocean exchange of organic carbon in the NE subtropical Atlantic. Geophys. Res. Lett. 32: L21807. • The prokaryotes are the only significant consumers of dissolved organic matter in the ocean. Therefore the only likely consumers of VOC. • Prokaryotic use of VOC may affect the air-sea equilibrium of VOC and therefore the magnitude of these fluxes.
VOC is rapidly used by bacteria (18 hr half-life compared to ~48 for sea water DOC). VOC as a highly labile source of carbon to support bacterial respiration Calleja et al. (unpub)
VOC experiment setup Filtered Atmospheric air High purity Synthetic air Vacuum pump VOC added Control Bottles inoculated with 0.8µm filtered SW collected in situ