Download
1 / 52
530 likes | 673 Views
Neuronal Correlates of BOLD. Peter A. Bandettini Unit on Functional Imaging Methods & Functional MRI Facility Laboratory of Brain and Cognition National Institute of Mental Health. PET D CBF>> D CMRO 2. -. -. The vascular response. Factors influencing [Deoxy-Hb] concentration. Oxygen

E N D
Neuronal Correlates of BOLD Peter A. Bandettini Unit on Functional Imaging Methods & Functional MRI Facility Laboratory of Brain and Cognition National Institute of Mental Health
PET DCBF>>DCMRO2 - - The vascular response Factors influencing [Deoxy-Hb] concentration Oxygen consumption Blood Volume + + [Deoxy- Hb] Blood Flow Velocity Courtesy of Arno Villringer
Time course of BOLD signal Yacoub E, Le TH, Ugurbil K, Hu X (1999) Magn Res Med 41(3):436-41 Courtesy of Arno Villringer
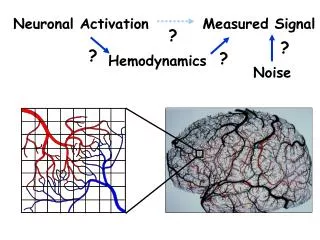
The Problem Measured Signal Neuronal Activation ? ? ? ? Hemodynamics Noise
What we observe • Magnitude • Location • Parametric Manipulation • Latency • Fluctuations
Location Anatomy BOLD Perfusion
Ocular Dominance Column Mapping using fMRI Menon, R. S., S. Ogawa, et al. (1997). “Ocular dominance in human V1 demonstrated by functional magnetic resonance imaging.” J Neurophysiol 77(5): 2780-7. Optical Imaging R. D. Frostig et. al, PNAS 87: 6082-6086, (1990).
Magnitude Jesmanowicz, P. A. Bandettini, J. S. Hyde, (1998) “Single shot half k-space high resolution EPI for fMRI at 3T.” Magn. Reson. Med. 40, 754-762.
5% CO2 12% O2 Hemodynamic Stress Calibration P. A. Bandettini, E. C. Wong, A hypercapnia - based normalization method for improved spatial localization of human brain activation with fMRI. NMR in Biomedicine 10, 197-203 (1997).
20 3 15 2 10 BOLD (% increase) CBF (% increase) 5 1 0 0 -5 -10 0 200 400 600 800 1000 1200 1400 0 200 400 600 800 1000 1200 1400 Time (seconds) Time (seconds) CBF BOLD Simultaneous Perfusion and BOLD imaging during graded visual activation and hypercapnia N=12
Computed CMRO2 Changes 40 30 20 10 0 % % -10 -20 -30 -40 Subject 2 Subject 1 R. Hoge et al.
HBM 2003 Poster number: 308 The Negative BOLD Response in Monkey V1 Is Associated with Decreases in Neuronal Activity Amir Shmuel*†, Mark Augath, Axel Oeltermann, Jon Pauls, Yusuke Murayama, Nikos K. Logothetis
Parametric Manipulation Motor Cortex Auditory Cortex S. M. Rao et al, (1996) “Relationship between finger movement rate and functional magnetic resonance signal change in human primary motor cortex.” J. Cereb. Blood Flow and Met. 16, 1250-1254. J. R. Binder, et al, (1994). “Effects of stimulus rate on signal response during functional magnetic resonance imaging of auditory cortex.” Cogn. Brain Res. 2, 31-38
fMRI responses in human V1 are proportional to average firing rates in monkey V1 Heeger, D. J., Huk, A. C., Geisler, W. S., and Albrecht, D. G. 2000.Spikes versus BOLD: What does neuroimaging tell us about neuronal activity? Nat. Neurosci. 3: 631–633. 0.4 spikes/sec -> 1% BOLD Rees, G., Friston, K., and Koch, C. 2000. A direct quantitative relationship between the functional properties of human and macaque V5. Nat. Neurosci. 3: 716–723. 9 spikes/sec -> 1% BOLD
Logothetis et al. (2001) “Neurophysiological investigation of the basis of the fMRI signal” Nature, 412, 150-157
Logothetis et al. (2001) “Neurophysiological investigation of the basis of the fMRI signal” Nature, 412, 150-157
Logothetis et al. (2001) “Neurophysiological investigation of the basis of the fMRI signal” Nature, 412, 150-157
BOLD Correlation with Neuronal Activity Logothetis et al. (2001) “Neurophysiological investigation of the basis of the fMRI signal” Nature, 412, 150-157. P. A. Bandettini and L. G. Ungerleider, (2001) “From neuron to BOLD: new connections.” Nature Neuroscience, 4: 864-866.
Evidence that inhibitory input produces increased blood flow
Number of spikes CBF Time / s 0 50 100 150 Time / s Divergence of spike rate and blood flow during parallel fiber stimulation Mathiesen, Caesar, Akgören, Lauritzen (1998), J Physiol 512.2:555-566
Flow modulation is not necessarily the same as BOLD modulation
Mediators of neurovascular coupling There isnot just one coupling mechanism. Mediators differ between brain regions NO is a mediator in the cerebellar cortex, but only a permissive factor in the somatosensory cortex Astrocytes may link synaptic activity to vascular response via Glutamate-induced Ca elevation and release of vasodilators at perivascular endfeets Metabolic factors (adenosine, pH, lactate, CO2) may act posthoc for finer long-term adjustment (not much relevance for BOLD!?) Courtesy of Arno Villringer
Negative BOLD in carotid artery disease Röther et al. NeuroImage 2002 Courtesy of Arno Villringer
Increase in deoxy-Hb and oxy-Hb during focal seizure 6 D[Oxy-Hb] 5 4 DµM 3 2 1 0 D[Deoxy-Hb] 2 1 DµM 0 -1 780 790 800 810 820 830 840 Courtesy of Arno Villringer
Altered neurovascular coupling: Pathology, drugs Courtesy of Arno Villringer
Latency and Width + 2 sec Latency - 2 sec Magnitude Venogram
Timing Modulation (calibration) 0 10 20 30 500 ms 500 ms RightHemifield Left Hemifield + 2.5 s - = 0 s - 2.5 s
B A A B A B Word vs. Non-word 0o, 60o, 120o Rotation Regions of Interest Inferior Frontal Gyrus Precentral Gyrus Middle Temporal Gyrus
No calibration Formisano, E. and R. Goebel, Tracking cognitive processes with functional MRI mental chronometry. Current Opinion in Neurobiology, 2003. 13: p. 174-181.
No calibration 11.7 T
Resting State Fluctuations conventional BOLD map low frequency autocorrelation map B. Biswal et al., MRM, 34:537 (1995)
The Skin Conductance Response (SCR) Ventromedial PFC Orbitofrontal Cortex Amygdala Hypothalamus Sympathetic Nervous System Resistance change across two electrodes induced by changes in sweating. Sweat Gland
Brain activity correlated with SCR during “Rest” J. C. Patterson II, L. G. Ungerleider, and P. A Bandettini, Task - independent functional brain activity correlation with skin conductance changes: an fMRI study. NeuroImage 17: 1787-1806, (2002).