Download
1 / 23
230 likes | 368 Views
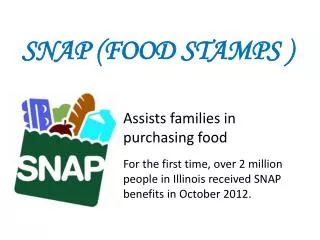
SNAP Formerly Food Stamps Comparison June 2010 to June 2011. For Oklahoma City MSA, Tulsa MSA, and t he Balance of the State. Prepared by the Community Service Council for the Metropolitan Human Services Commission in Tulsa September 2011. How many people use SNAP food assistance?.

E N D
SNAPFormerly Food StampsComparisonJune 2010 to June 2011 For Oklahoma City MSA,Tulsa MSA, and the Balance of the State Prepared by the Community Service Council for the Metropolitan Human Services Commission in Tulsa September 2011
How many people use SNAP food assistance? answer: 612,000 • 16% or 287,340 Oklahomans outside the two major Metropolitan Statistical Areas received SNAP benefit in June of 2011 • The percent of population ranged from a low of 6% in Dewey County in northwestern Oklahoma to over 30% in Adair County in northeastern Oklahoma • The two major metropolitan areas make up over 50% of the total SNAP recipients • 14.6% or 87,850 of Tulsa County’s population received SNAP in June and in the seven county MSA was a little higher at 14.7% or 138,120 people • The Oklahoma City area had an opposite situation, where 17.5% or 126,120 people in Oklahoma County and 14.9% or 186,820 people in the MSA population • OKDHS estimates that 30% or 275,000 children in Oklahoma receive food assistance through SNAP File: SNAP June 2010 2011 Tul OKC MSAs
How has SNAP use changed ? • The Tulsa MSA went from 13.9% of the population receiving SNAP to 14.7% in one year (June 2010 to June 2011) an increase of 7,700 people • The Oklahoma City MSA went from 14.5% of the population receiving SNAP to 14.9% during the same time period, gaining 5,280 • The balance of the state went from 17.7% in June of 2010 to 18.4% of the population in 2011, an increase of 10,980 • The rate per 100,000 population increased in one year: • Tulsa MSA +6% • OKC MSA +3% • Balance of the state +4% • Over the last five years the increases were: • Tulsa MSA +54% • OKC MSA +48% • Balance of the state +41%
Average Dollar Amount Per Meal Provided with SNAP Range$1.49 meal/person Tulsa & Oklahoma Countiesto$1.16 meal/person Grant County Source: Oklahoma Department Human Services, Monthly Statistical Bulletin, June, 2010 & 2011 Prepared by the Community Service Council for the Metropolitan Human Services Commission in Tulsa, September 2011
Percent of population receiving benefit of SNAP, 2011 • Oklahoma Total 15.7% Range: • Adair County 30.4% • Dewey County 5.9% • Tulsa County 14.6% • Oklahoma County 17.5% Source: Oklahoma Department Human Services, Monthly Statistical Bulletin, June, 2010 and 2011; and 2010 U.S. Bureau of the Census Prepared by the Community Service Council for the Metropolitan Human Services Commission in Tulsa, September 2011
SNAP - Recipients Percent of Population and Rate Per 100,000 Oklahoma City and Tulsa Metropolitan Statistical Areas (MSAs), and Balance of the StateOne Year Number and Percent ChangeJune 2010 compared to June 2011 File: SNAP June 2010 2011 Tul OKC MSAs
Oklahoma Percent of Population Receiving Benefit of SNAP2010 compared to 2011 Tulsa MSA Source: Oklahoma Department Human Services, Monthly Statistical Bulletin, June, 2010 and 2011; and 2010 U.S. Bureau of the Census Prepared by the Community Service Council for the Metropolitan Human Services Commission in Tulsa, September 2011
SNAP Recipients Rate Per 100,000 People 2010 compared to 2011 Source: Oklahoma Department Human Services, Monthly Statistical Bulletin, June, 2010 and 2011; and 2010 U.S. Bureau of the Census Prepared by the Community Service Council for the Metropolitan Human Services Commission in Tulsa, September 2011
SNAP One Year Percent ChangeRate per 100,000 People 2010 compared to 2011 Source: Oklahoma Department Human Services, Monthly Statistical Bulletin, June, 2010 and 2011; and 2010 U.S. Bureau of the Census Prepared by the Community Service Council for the Metropolitan Human Services Commission in Tulsa, September 2011
SNAP Cases Oklahoma City and Tulsa Metropolitan Statistical Areas (MSAs), and Balance of the StateOne Year Number and Percent ChangeJune 2010 compared to June 2011 File: SNAP June 2010 2011 Tul OKC MSAs
SNAP Food Stamp CasesOne Year Number ChangeJune 2010 to June 2011 Source: Oklahoma Department Human Services, Monthly Statistical Bulletin, June, 2010 and 2011 Prepared by the Community Service Council for the Metropolitan Human Services Commission in Tulsa, September 2011
SNAPFood Stamp CasesOne Year Number Change June 2010 to June 2011 +8,282 +4,330 Source: Oklahoma Department Human Services, Monthly Statistical Bulletin, June, 2010 and 2011 Prepared by the Community Service Council for the Metropolitan Human Services Commission in Tulsa, September 2011
SNAPFood Stamp CasesOne Year Percent Change June 2010 to June 2011 +7.1 % +5.3 % Source: Oklahoma Department Human Services, Monthly Statistical Bulletin, June, 2010 and 2011 Prepared by the Community Service Council for the Metropolitan Human Services Commission in Tulsa, September 2011
SNAP Recipients Oklahoma City and Tulsa Metropolitan Statistical Areas (MSAs), and Balance of the StateOne Year Number and Percent ChangeJune 2010 compared to June 2011 File: SNAP June 2010 2011 Tul OKC MSAs
SNAPFood Stamp RecipientsOne Year Number Change June 2010 to June 2011 Source: Oklahoma Department Human Services, Monthly Statistical Bulletin, June, 2010 and 2011 Prepared by the Community Service Council for the Metropolitan Human Services Commission in Tulsa, September 2011
SNAPFood Stamp RecipientsOne Year Number Change June 2010 to June 2011 +10,979 Source: Oklahoma Department Human Services, Monthly Statistical Bulletin, June, 2010 and 2011 Prepared by the Community Service Council for the Metropolitan Human Services Commission in Tulsa, September 2011
SNAPFood Stamp Recipients One Year Percent Change June 2010 to June 2011 +4.0% Source: Oklahoma Department Human Services, Monthly Statistical Bulletin, June, 2010 and 2011 Prepared by the Community Service Council for the Metropolitan Human Services Commission in Tulsa, September 2011
SNAP Recipients Oklahoma City and Tulsa Metropolitan Statistical Areas (MSAs), and Balance of the StateFive Year Percent Change2006 compared to 2011 File: SNAP June 2010 2011 Tul OKC MSAs
SNAPFood Stamp Recipients Five YearPercent Change June 2006 to June 2011 Source: Oklahoma Department Human Services, Monthly Statistical Bulletin, June, 2010 and 2011 Prepared by the Community Service Council for the Metropolitan Human Services Commission in Tulsa, September 2011
MSA: Metropolitan Statistical Area • Balance of the State: 63 counties outside of the 14 counties ion the Oklahoma City and Tulsa MSAs • SNAP: Supplemental Nutrition Assistance Program, a program provided by the U.S. Government Definitions Source: Oklahoma Department Human Services, Monthly Statistical Bulletin, June, 2010 & 2011 Prepared by the Community Service Council for the Metropolitan Human Services Commission in Tulsa, September 2011
Metropolitan Statistical Areas/ Counties Oklahoma City MSA Canadian Cleveland Grady Lincoln Logan McClain Oklahoma Tulsa MSA Creek Okmulgee Osage Pawnee Rogers Tulsa Wagoner • There are two other MSAs in Oklahoma: • Fort Smith MSA (Counties) • Le Flore • Sequoyah • Lawton MSA (Counties) • Comanche File: SNAP June 2010 2011 Tul OKC MSAs
The Metropolitan Human Services Commission in Tulsa, partnership includes: Mission To serve as a leadership catalyst for coordination of funding, planning and policy decisions affecting human capital development in Tulsa County, and provide guidance to its partners to best enhance that development. Scope of Concern Advancing the community’s investment in human capital includes the scope of efforts addressing the education, safety, health, housing, family support, emergency financial, transportation and employment preparation needs of families and individuals. These efforts increasingly seek to prevent needs through promoting greater self-sufficiency among Tulsa’s people while still intervening to respond to crises and other immediate concerns. City of Tulsa Oklahoma Department of Human Services Tulsa Area United Way Tulsa Community College Tulsa County Tulsa Health Department Tulsa Public Schools Tulsa Technology Center Union Public Schools Tulsa Metro Chamber Ad Hoc member File: SNAP June 2010 2011 Tul OKC MSAs
http://kotv.images.worldnow.com/images/14137548_BG1.jpg http://fwixcdn.fwix.com/flickr/Le81e6867974145e0fc70ffc0d15193e3.PNG http://img.ehowcdn.co.uk/article-page-main/ehow/images/a07/7u/99/apply-food-stamps-children-800x800.jpg Image/Photo Credits File: SNAP June 2010 2011 Tul OKC MSAs Prepared by the Community Service Council for the Metropolitan Human Services Commission in Tulsa, September 2011