Download
1 / 21
210 likes | 334 Views
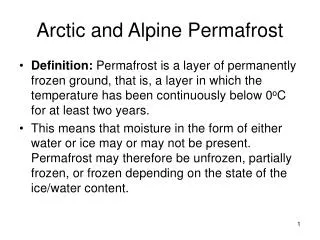
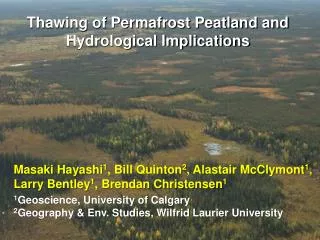
Thawing of Permafrost Peatland and Hydrological Implications. Masaki Hayashi 1 , Bill Quinton 2 , Alastair McClymont 1 , Larry Bentley 1 , Brendan Christensen 1 1 Geoscience, University of Calgary 2 Geography & Env . Studies, Wilfrid Laurier University.

E N D
Thawing of Permafrost Peatland and Hydrological Implications Masaki Hayashi1, Bill Quinton2, Alastair McClymont1, Larry Bentley1, Brendan Christensen1 1Geoscience, University of Calgary2Geography & Env. Studies, Wilfrid Laurier University
Prediction of Permafrost Thaw, 1990-2090 • Model Assumptions • Vertical energy transfer • Large (50 km) grids • No lateral flow of water and energy Scotty Creek Reality (Scotty Creek) Hay River Lowland pink: complete thawing Zhang et al. (2008. Geophys. Res. Lett., 35: L02502) lake peat plateau isolated bog connected bog channel fen 1 km
Annual Total Basin Runoff near Ft. SimpsonFour Rivers (150-1,900 km2), Similar Landcovers Runoff = Total flow / Drainage area annual runoff (mm) precipitation (mm)
flat bog peat plateau channel fen
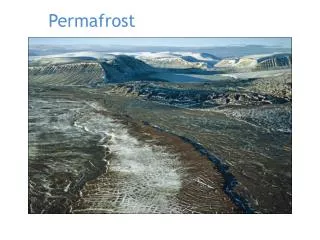
permafrost Peat Plateaus Have Permafrost Cores channel fen Water flows over frozen peat. bog
0.5 m 0.9 m Frost Table in Late August 2006 GS: ground surface FT: frost table ground surf. frost table
ground srf. T = Ts zf Qm T = 0 frost table Conduction dominates heat flux. Qm = lb (Ts – 0) / zf Differential Thawing by Conduction l (W m-1 K-1) water content lb : bulk thermal conductivity Wet spots thaw faster. Hayashi et al. (2007, Hydrol. Proces. 21: 2610-2622)
2D Survey of Frost Table (FT)June 12, 2006 ground surf. FT • Subsurface flow simulation: 15 mm of rain added.Boussinesq equation is numerically solved. • FT measured using FT probe on 0.25 m grids. Wright et al. (2009, Water Resour. Res. 45: W05414)
Electrical Resistivity Imaging (ERI) fen bog unfrozen peat permafrost FT clay plateau fen bog 0 m 20 40 60 80 0 m 5 10 15 20 resistivity (W m) 102 103 104
ERI Line 1: Peat Plateau Transect depression unfrozen peat permafrost FT clay plateau fen bog 0 m 20 40 60 80 0 m 5 10 15 20 20 m 30 40 50 60 0 2 4 resistivity (W m) 102 103 104
ERI Line 2: Cross-Bog Transect 100m fen isolated bog bog 0 m 20 40 60 80 clay clay sand lens 0 m 5 10 15 20 resistivity (W m) 102 103 104
peat plateau 1 2 preferential thaw new bog 3 Conceptual Model of Permafrost Thaw • Thinning of canopy. Increase in radiation energy input. • Local thawing. Water-energy feedback causes further thawing. • Wet condition prevents trees from growing back. New bog forms. unsaturated, thawed peat saturated, thawed peat saturated, frozen peat
Delineation of Peat Plateau on Aerial Images 1977 200 m Quinton et al. (2011, Hydrol. Proces., 25: 152)
Delineation of Peat Plateau on Aerial Images 2008 Peat Plateau Area 1977: 53% 2008: 43% 200 m Quinton et al. (2011, Hydrol. Proces., 25: 152)
Changes Evident on the Ground Aug. 2002 July 2010 Datalogger Datalogger
Modelling Peat Plateau Runoff • Hydraulically equivalent plateau • Drainage of ground-water controlled by: • Radius • Gradient • Ksat distribution • Frost-table depth Similar to MESH, but the moving FT is the challenge. 200 m
Coupled Permafrost-Hydrology Model for Circular Peat Plateau vertical transfer lateral drainage Northern Ecosystem Soil Temperature (NEST) modelZhang et al. (2008) Simple Fill and Spill Hydrology (SFASH) modelWright et al. (2009)
NEST-SFASH Preliminary Results frost table (m) water flux (mm/d) J F M A M J J A S O N D J F M A M J J A S O N D J F M A M J J A S O N D J F M A M J J A S O N D 2009 2010 2009 2010
Challenges and the Way Forward • Storage and flow of runoff water in the fen-bog network Basin-scale hydrological model. • Incorporate lateral thawing of permafrost in long-term model simulation (e.g. 50 years). • Ecology-hydrology feedback processes. IP3 Legacy • Scotty Creek research basin • Close collaboration with the local First Nation. • WLU-Northwest Territories Partnership for Research and Training (2010-2020, $10M project).
Acknowledgements PeopleNicole Wright, Laura Chasmer, Chris Hopkinson, Tyler Veness, Rob Schincariol, and many others FundingIP3 NetworkInternational Polar YearNatural Sciences and Engineering Research CouncilCanada Research Chair ProgramEnvironment Canada Science Horizons Program Logistical Support Water Survey of CanadaEnvironment Canada (NWRI)Liidlii Kue First Nations