Download

1 / 14
140 likes | 248 Views
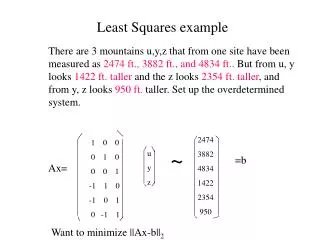
The Least Squares Line. Lesson 1.3. Problems with Data. Real data recorded Experiment results Periodic transactions Problems Data not always recorded accurately Actual data may not exactly fit theoretical relationships In any case …

E N D
The Least Squares Line Lesson 1.3
Problems with Data • Real data recorded • Experiment results • Periodic transactions • Problems • Data not always recorded accurately • Actual data may not exactly fit theoretical relationships • In any case … • Possible to use linear (and other) functions to analyze and model the data
Fitting Functions to Data • Consider the data given by this example • Note the plot ofthe data points • Close to beingin a straight line
Finding a Line to Approximate the Data • Draw a line “by eye” • Note slope, y-intercept • Statistical process (least squares method) • Use a computer programsuch as Excel • Use your TI calculator
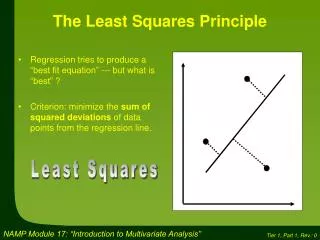
Least Squares Line • Note text development of analyzing the data, pg 32, 33 for Y = mx + b, we can find m and b • Coefficient of Correlation Simultaneous linear equations
Correlation Coefficient • A statistical measure of how well a modeling function fits the data • -1 ≤ corr ≤ +1 • |corr| close to 1 high correlation • |corr| close to 0 low correlation • Note: high correlation does NOT imply cause and effect relationship
Regression on the Calculator • Example: Calories per min, and weight • Enter data into data matrix ofcalculator • APPS, 6, Current, Clear contents
Using Regression On Calculator • Choose F5 for Calculations • Choose calculationtype (LinReg for this) • Specify columns where x and y values will come from
Using Regression On Calculator • It is possible to store the Regression EQuation to one of the Y= functions
Using Regression On Calculator • When all options areset, press ENTER andthe calculator comesup with an equation approximates your data Note both the original x-y values and the function which approximates the data
Using the Function • Resulting function: • Use function to find Caloriesfor 195 lbs. • C(195) = 5.24This is called extrapolation • Note: It is dangerous to extrapolate beyond the existing data • Consider C(1500) or C(-100) in the context of the problem • The function gives a value but it is not valid
Interpolation • Use given data • Determine proportional“distances” x 25 0.8 30 Note : This answer is different from the extrapolation results
Interpolation vs. Extrapolation • Which is right? • Interpolation • Between values with ratios • Extrapolation • Uses modeling functions • Remember do NOT go beyond limits of known data
Assignment • Lesson 1.3 • Page 38 • Exercises 5 – 15 odd