Download
1 / 29
290 likes | 446 Views
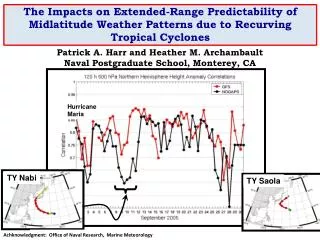
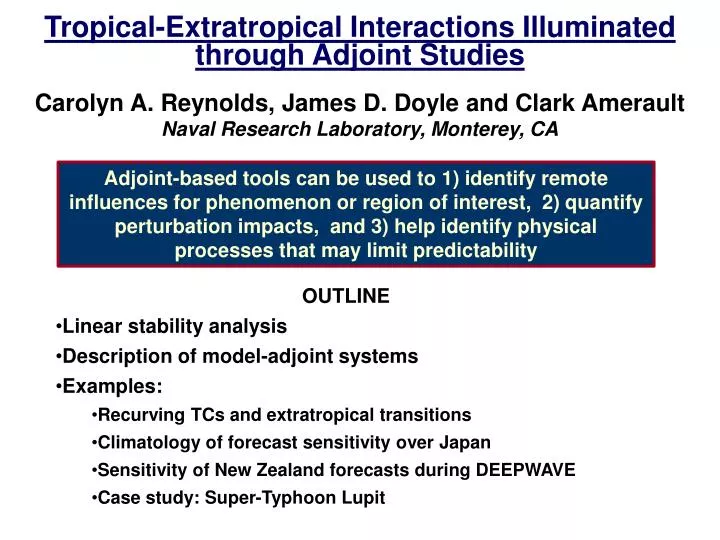
Tropical- Extratropical Interactions Illuminated through Adjoint Studies. Carolyn A. Reynolds, James D. Doyle and Clark Amerault Naval Research Laboratory, Monterey, CA.

E N D
Tropical-Extratropical Interactions Illuminated through Adjoint Studies Carolyn A. Reynolds, James D. Doyle and Clark Amerault Naval Research Laboratory, Monterey, CA Adjoint-based tools can be used to 1) identify remote influences for phenomenon or region of interest, 2) quantify perturbation impacts, and 3) help identify physical processes that may limit predictability • OUTLINE • Linear stability analysis • Description of model-adjoint systems • Examples: • Recurving TCs and extratropical transitions • Climatology of forecast sensitivity over Japan • Sensitivity of New Zealand forecasts during DEEPWAVE • Case study: Super-Typhoon Lupit
Linear Stability Analysis Characterize stability of system by examining behavior of perturbation growth in linear framework. Nonlinear Tangent Linear pt=Mx0–M(x0+ p0) pt = M0,t p0 or Tangent Linear Model (TLM) Tangent forward propagator State vector Perturbation vector Nonlinear Model pt p0 Leading Singular Vector (SV) of M: Fastest growing perturbation. Adjoint of M: allow for calculation of sensitivity of a particular response function to changes in the initial state. Leading SV and adjoint sensitivity both highlight rapidly growing structures.
Linear Stability Analysis Transient (finite time interval) Asymptotic (t => ∞) Leading Normal Modes Eigenvector of M Fastest growing mode on a steady basic state Adjoint Sensitivity Apply MT (adjoint of M) Gives sensitivity of forecast aspect to changes in the initial state SVs can resemble normal mode structure after initial transient period Floquet vectors (E-vectors of M for periodic flow) bridge gap Adjoints and SVs often similar, both highlight rapidly growing structures Leading Lyapunov Vector LLV Fastest growing perturbation to a an evolving basic state Leading Singular Vectors SVs of M, E-vectors of MTM Fastest growing perturbation to a steady or evolving basic state Leading SV will converge to leading LLV as opt. time increases
System Description NOGAPS: Navy Operational Global Atmospheric Prediction System Hydrostatic global model 4DVAR Data Assimilation TLM/Adjoint:Often run “dry”, usually at T79 (167km) based on operational (55km) forecast COAMPS: Coupled Ocean/Atmosphere Mesoscale Prediction System Non-hydrostatic mesoscale model 3DVAR and EnKFData Assimilation (4DVAR in advanced development) TLM/Adjoint: Warm microphysics Usually run at 45 or 15 km TLM/Adjointapplications limited by linearity assumptions. Moist processes and higher resolution more nonlinear. Adjoint of new Navy global model (NAVGEM ) currently in development.
Focus on Recurving TCs and Extratropical Transitions • Recurving TCs • Sensitive to upstream troughs (Harr and Elsberry 1991, Peng and Reynolds 2006, Wu et al. 2009, Reynolds et al. 2009, Kim and Jung 2009, Brennan and Majumdar 2011, Hoover and Morgan 2011) • Extratropical transitions of TCs: • ET process sensitive to detailed interactions with mid-latitude systems, in particular the phasing of TC with upstream trough (Harr et al. 2000; Klein et al. 2002, Ritchie and Elsberry 2007, McTaggart-Cowan et al. 2001, Hart et al. 2006, Reimer et al. 2008 ….) • Often have strong impact on mid-latitude flow downstream(Bosart and Lackmann 1995, Harr and Dea2009, Reimer and Jones 2010, Sheck et al 2011., Grams et al. 2011, Grams et al. 2013, Pantillon et al. 2013, Archambault et al. 2013 ….). • Often associated with increased forecast error/ increased ensemble spread/ decreased predictability (e.g., Jones et al. 2003, Harr et al. 2008, Anwender et al. 2008, Keller et al. 2014 …). • Impact of SV-based adaptive observations over the North Atlantic 4x higher during ET than the impact averaged for all cases (Cardinali et al. 2007)
Grams et al. 2013 QJRMS, illustrate sensitivity of downstream flow (340K Isentropic PV, 3PVU contour) by repositioning TC Jangmi. ET and downstream impact very sensitive to phasing with mid-latitude trough. SVs also highlight sensitivity to trough when TCs recurve. 0913 0914 NOGAPS SVs for TC Shanshan (2006) Early stage: concentrated around storm Recurvature: associated with a trough, other features, to the northwest Transition: patterns are very complex 0915 0916 NOGAPS 2-d SV intial-time total energy (shading), analyzed 500-hPa streamlines (black), location of TC (black circle). Reynolds et al. 2009. 0917
Several studies show enhanced mid-latitude ensemble spread downstream of ET. SVs also show downstream energy propagation. Impact of ET on Ensemble Spread SV 200-hPa V perturbations for TC Shanshan(Reynolds et al. 2009) 0916 0917 0918 0919 0920 0921 50-60N Anwender et al. 2008 MWR Sinlaku 0916 0917 0918 0919 0920 0921 30-40N 120E 60W Keller et al. 2014 MWR Reynolds et al. 2010 WAF -32 -16 -8 -4 -2 2 4 8 16 32
NOGAPS Non-Linear SV Perturbation Growth for 2006 WPAC TCs 2-day Optimization Time Perturbation growth much greater when TCs recurve and perturb the mid-latitude wave guide. Growth larger when Eady index of baroclinic instability index higher.
Mid-latitude Sensitivity Climatology: • Leverage THORPEX Pacific Asian Regional Campaign (T-PARC) • Tropical Cyclone Structure 08 (TCS-08) • NOGAPS SVs calculated for 5 regions • T79L30 adjoint/TLM resolution • T239L30 (operational) trajectory • Dry Total Energy norm 3 4 5 2 1 • FOR THIS STUDY • Consider Japan region only • 48-h Optimization time • 00Z daily, June 2009-May 2010 • Markers indicate regions where energy of any of the first three SVs exceeds 70% of the maximum energy of first SV (Palmer et al. 1998) • KE (square) and PE (circle) considered separately • Altitude denoted by color (red-high, purple-middle, blue-low) • Centered on Guam • Storms affecting Taiwan • Storms affecting Japan • ET Region • Central North Pacific
Markers indicate initial locations of fast-growing perturbations that impact 2-day forecast over Japan 80% 80% 9 TCs in JJA Vamco KE: Box PE: Circle Molave Morakot Summer has several targets in tropics associated with TCs. 25% of targets occur above 400-hPa. 10% of targets occur west of 100E.
80% Nepartak Lupit 80% 11 TCs in SON Melor KE: Box PE: Circle Fall has targets in subtropics, along with the most distant target (4,000 km) over Kara Sea associated with amplified pattern, strong NW flow.
80% 80% 1 TC in DJF KE: Box PE: Circle Winter has few targets above 400-hPa, few targets S. of 30N. 10% occur west of 80E. Consistent with strong westerly flow and low-level baroclinic instability.
80% 80% 1 TC in MAM KE: Box PE: Circle Spring has few targets south of 30N, with 10% of targets west of 88E.
Targets occur north of 60N for all seasons Fall has the greatest range of targets Winter and Spring have the most targets further west Summer and Fall have the most tropical targets JJA-Black SON-RedDJF-GreenMAM-Blue
Zonal Wind Seasonal Averages 60-120E Summer: Weaker low-level winds and vertical shear consistent with fewer low-level targets Fall: Strong winds at 60N consistent with large number of high-latitude targets SON JJA Winter and Spring: Stronger mid-tropospheric winds consistent with far-west targets DJF MAM Image provided by the NOAA/ESRL Physical Sciences Division, Boulder Colorado: http://www.esrl.noaa.gov/psd/
SH Example: COAMPS (moist, 24-h) Predictability Targets for DEEPWAVE Field Phase: June-July 2014 Weak-Blue/GreenModerate-YellowStrong-MagentaVery Strong-Purple Several NCAR GV flights sampled sensitive regions 24-h Sensitivity of low-level winds over NZ South Island exhibited extremely varied flow-dependent behavior. Targets varied from over the island itself, to 2,000 km away.
Case Study: NOGAPS 48-h SVs (700-hPa T) for TC Lupit, OCT 2009 48-h coarse-resolution dry SVs show large-scale features of influence. To understand role of moisture and fine-scale features, use COAMPS high-resolution moist-adjoint. http://agora.ex.nii.ac.jp/digital-typhoon/ SV sensitivity extends to NW throughout lifecycle, but more spatially expansive during recurvature. ET sensitive regions includes trough to NW, central Asia, and ridge to NE.
COAMPS 12-h 15-km Moist Adjoint: Late ET Stage: 12Z 26 Oct COAMPS 925-hPa Radar Reflectivity and SLP (red) COAMPS 925-hPa Radar Reflectivity and sensitivity to Q (red-pos, blue-neg) Background 925-hPa Theta Complex moisture sensitivity pattern extending both to the southern part of the circulation, extending along precipitation to the north. Sensitive perturbations align with areas of strong frontogenesis and high PV (extra slides).
Summary • SVs illustrate how small changes made to recurving TC forecasts grow and propagate rapidly downstream through interactions with mid-latitude wave guide. • SVs and adjoint sensitivity can diagnose location and frequency of remote influences on a particular region or event of interest. Results highlight spatial variability and occasional large distances (2000 km/day). • COAMPS high-resolution moist-adjoint highlights importance of fine-scale moist processes for tropical and extra-tropical cyclones. Severe mid-latitude storm Xynthia (Feb 2010) very sensitive to moisture and temp perturbations in subtropical moisture plume (presentation by J. Doyle) COAMPS 45-km adjoint sensitivity to 700-hpa water vapor, valid 1200Z 26 Feb Meteosat-9 IR 1345Z 26Feb and Xynthia minimum SLP from DWD every 6h from 1200Z 26Feb 2010 SSMI/AMSR-E TPW valid 1200Z 26 Feb 2010
Shanshan 0913 Shanshan 0916 Before Recurvature During Recurvature NL SV 500-hPa V Perturbations: Downstream Impacts 0 h Initially small (<2 m/s) 72 h After 3-days, much larger (>10 m/s), extend across Pacific in recurving case. 120 h After 5-days, >20 m/s, extend to N. American in recurving case. Reynolds et al. 2009.
ET Stage: 12 UTC 26 Oct COAMPS 925-hPa sensitivity to q (contour) and background frontogenesis (shaded) COAMPS 850-hPa optimal perturbation PV (contours) and background PV (shaded) Sensitivity in regions of frontogenesis, but not perfectly aligned with it. PV of optimal perturbation large in regions of large background PV.
Late ET Stage: 12 UTC 26 Oct COAMPS optimal perturbation PV (color contours), background PV(shaded), and background theta (black contours) COAMPS 850-hPa optimal perturbation PV (contours) and background PV (shaded) A B B A PV of optimal perturbation aligned with strong PV regions in vertical.
Late ET Stage: 12 UTC 26 Oct COAMPS sensitivity to Q (shaded), and background theta (black contours) COAMPS 850-hPa optimal perturbation PV (contours) and background PV (shaded) Sensitivity to Q strongest in region along temperature gradient.
Late ET Stage: 12 UTC 26 Oct: NL Evolution to 48 h COAMPS optimal perturbation 250-hPa V (color contours), background 250-hPa Z (black contours) 12 24 48 36 Downstream propagation apparent at upper levels, but growth rate is small
Image provided by the NOAA/ESRL Physical Sciences Division, Boulder Colorado: http://www.esrl.noaa.gov/psd/
Image provided by the NOAA/ESRL Physical Sciences Division, Boulder Colorado: http://www.esrl.noaa.gov/psd/
Image provided by the NOAA/ESRL Physical Sciences Division, Boulder Colorado: http://www.esrl.noaa.gov/psd/
Image provided by the NOAA/ESRL Physical Sciences Division, Boulder Colorado: http://www.esrl.noaa.gov/psd/