Download
1 / 31
320 likes | 450 Views
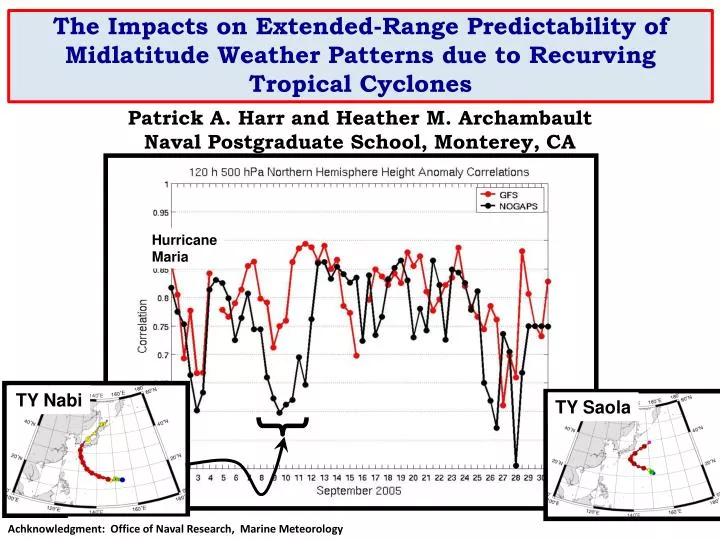
The Impacts on Extended-Range Predictability of Midlatitude Weather Patterns due to Recurving Tropical Cyclones. Hurricane Maria. Patrick A. Harr and Heather M. Archambault Naval Postgraduate School, Monterey, CA. TY Nabi. TY Saola.

E N D
The Impacts on Extended-Range Predictability of Midlatitude Weather Patterns due to Recurving Tropical Cyclones Hurricane Maria Patrick A. Harr and Heather M. ArchambaultNaval Postgraduate School, Monterey, CA TY Nabi TY Saola Achknowledgment:Office of Naval Research, Marine Meteorology
Composite flow evolution associated with TC recurvature N = 292 250-hPa PV (blue, PVU), meridional wind anomalies (shaded, m s−1), and regions where anomalies are significant at 99% confidence level (black)
Operational GEFS uncertainty with TC Malakas (2010) Initialization time Blue: Verifying forecastRed: Ensemble forecast meanGreen: Ensemble forecast members (N = 20)
Operational GEFS uncertainty with TC Malakas (2010) F+24 h Blue: Verifying forecastRed: Ensemble forecast meanGreen: Ensemble forecast members (N = 20)
Operational GEFS uncertainty with TC Malakas (2010) F+48 h Blue: Verifying forecastRed: Ensemble forecast meanGreen: Ensemble forecast members (N = 20)
Operational GEFS uncertainty with TC Malakas (2010) F+72 h Blue: Verifying forecastRed: Ensemble forecast meanGreen: Ensemble forecast members (N = 20)
Operational GEFS uncertainty with TC Malakas (2010) F+96 h Blue: Verifying forecastRed: Ensemble forecast meanGreen: Ensemble forecast members (N = 20)
Operational GEFS uncertainty with TC Malakas (2010) F+120 h Blue: Verifying forecastRed: Ensemble forecast meanGreen: Ensemble forecast members (N = 20)
Monthly distribution of TC recurvature Recurvature: 292 of 801 WNP TCs; 36.5% % that recurve Archambault et al. 2013
Recurving western North Pacific TC Tracks: 1979–2009 N = 292 KEY: TD TS TY EC Mean TC recurvature point: 24.9°N, 134.0°E
ESRL/PSD second-generation reforecast data (Hamill et al. 2013) • Reforecasts of 2012 version of NCEP Global Ensemble Forecasting System (GEFS) initialized with 0000 UTC CFSR initial conditions for 1985–present • Ensemble contains 10 perturbed members plus a control run • Members are perturbed using ensemble transform with rescaling technique • T254 (~0.5°) horizontal resolution; 42 vertical levels • Continuous, homogenous dataset ideal for systematically examining predictability of large-scale flow surrounding TC recurvature
Methodology • Compute root mean-square errors (RMSEs), anomaly correlations (ACs) and ensemble spread (standard deviation) for 500-hPa geopotential height reforecasts verifying during western North Pacific TC recurvature between 1985-2010 (N = 224) • May – November • Western North Pacific (WPAC) • North Pacific (NPAC) • Northern Hemisphere (NH) • Compare against climatology of reforecast RMSEs, ACs, and ensemble spread to test whether skill and uncertainty during recurvature are significantly different from climatology
Domains for computing forecast skill and uncertainty statistics Western North Pacific
Domains for computing forecast skill and uncertainty statistics North Pacific
Domains for computing forecast skill and uncertainty statistics Northern Hemisphere
‘Climo’ minus ‘recurving TC’ RMSE: West Pacific -3 - 2 -1 0 1 2 3 (m) 8-day forecast verifying 4 days past recurvature
‘Climo’ minus ‘recurving TC’ RMSE significance: West Pacific > 97.5% Significance (negative tail) > 97.5% Significance (positive tail) Increased Skill Decreased Skill
‘Climo’ minus ‘recurving TC’ RMSE significance: West Pacific 8-day forecast verifying 4 days past recurvature > 97.5% Significance (negative tail) > 97.5% Significance (positive tail) Increased Skill Decreased Skill
‘Climo’ minus ‘recurving TC’ RMSE significance: West Pacific Forecasts initialized before recurvature and verifying before recurvature have increased skill Forecasts initialized just before recurvature and verifying after recurvature have degraded skill > 97.5% Significance (negative tail) > 97.5% Significance (positive tail) Increased Skill Decreased Skill
Increased skill Decreased skill > 97.5% Significance (negative tail) > 97.5% Significance (positive tail) Increased Skill Decreased Skill
Increased skill Decreased skill > 97.5% Significance (negative tail) > 97.5% Significance (positive tail) Increased Skill Decreased Skill
Decreased skill > 97.5% Significance (negative tail) > 97.5% Significance (positive tail) Decreased Skill Increased Skill
Decreased skill at longer lead times > 97.5% Significance (negative tail) > 97.5% Significance (positive tail) Decreased Skill Increased Skill
‘Recurving’ TC Forecast - Analysis + 24 h NPAC
‘Recurving’ TC Forecast - Analysis + 48 h NPAC
‘Recurving’ TC Forecast - Analysis + 72 h NPAC
‘Recurving’ TC Forecast - Analysis + 96 h NPAC
‘Recurving’ TC Forecast - Analysis + 120 h NPAC
‘Recurving’ TC Forecast - Analysis + 144 h NPAC
‘Recurving’ TC Forecast - Analysis Flow pattern of N. America is under amplified + 168 h NHem
Conclusions • In a climatological sense, recurvature of WPAC TCs impacts midlatitude predictability • Decrease in skill and increase in spread (not shown) for forecasts initialized prior to recurvature but verifying after recurvature • Increase in skill and decrease in spread (not shown) for forecasts that verify prior to recurvature • Decreased skill after recurvature mainly at longer forecast intervals (beyond 5 days) • Of the three regions examined, the North Pacific region is most sensitive to decreases in skill and increases in spread. • Tropical cyclone recurvature coincides with a transition from a high to low predictability regime as defined by statistically significant decreased skill and increased spread