Download
1 / 15
150 likes | 275 Views
TeraGrid 2006 By the Numbers. Compute Resource Change. Additions: NCSA (Cobalt, Copper, Xeon Linux Supercluster, Condor Cluster) SDSC (DataStar p655, DataStar p690, BlueGene) Purdue (Condor+) TACC (LoneStar+) IU: (BigRed) PSC: (BigBen+) Retirements: PSC: (TCS1) IU: ( - IA 32 & 64)

E N D
Compute Resource Change Additions: NCSA (Cobalt, Copper, Xeon Linux Supercluster, Condor Cluster) SDSC (DataStar p655, DataStar p690, BlueGene) Purdue (Condor+) TACC (LoneStar+) IU: (BigRed) PSC: (BigBen+) Retirements: PSC: (TCS1) IU: ( - IA 32 & 64) Upcoming: TACC (Ranger), NCAR (Frost) + HPCOPS (NCSA (Abe) +) + Track 2’ (?) + ???
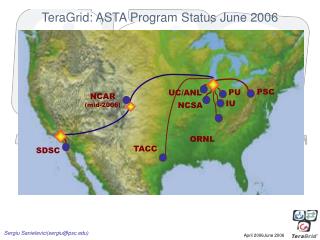
Networking Abilene NCSA UC/ANL PSC 3x10G each NCAR 1x10G 1x10G LA DEN CHI 1x10G 1x10G 1x10G ORNL 1x10G Cornell 2x10G IPGrid 2x10G 1x10G 1x10G each SDSC TACC PU IU
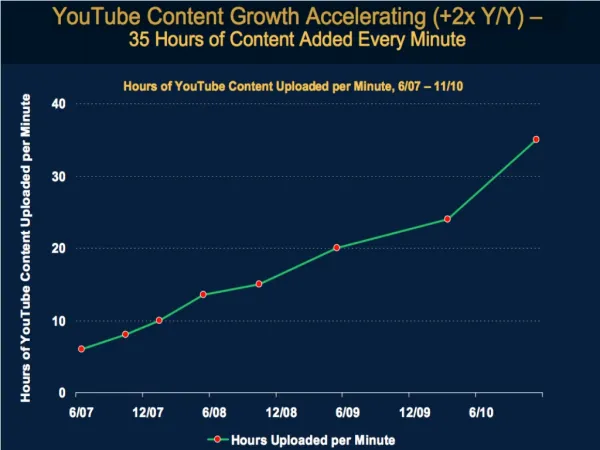
TeraGrid Usage Growth 200 Specific Allocations Roaming Allocations Normalized Units (millions) 100 TeraGrid currently delivers to users an average of 400,000 cpu-hours per day -> ~20,000 CPUs DC
TeraGrid User Community Growth Begin TeraGrid Production Services (October 2004) Incorporate NCSA and SDSC Core (PACI) Systems and Users (April 2006) Decommissioning of systems typically causes slight reductions in active users. E.g. December 2006 is due to decommissioning of Lemeux (PSC). (*FY06 new users/qtr excludes Mar/Apr 2006)
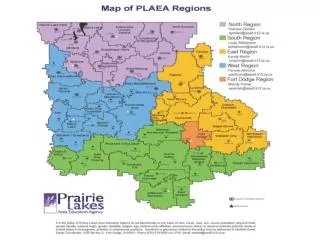
TeraGrid Projects by Institution Blue: 10 or more PI’s Red: 5-9 PI’s Yellow: 2-4 PI’s Green: 1 PI TeraGrid allocations are available to researchers at any US educational institution by peer review. Exploratory allocations can be obtained through a biweekly review process. See www.teragrid.org. 1000 projects, 3200 users
FY06 Quarterly Usage by Discipline 100 Percent Usage 50
TeraGrid User Community in 2006 Grid-y Users
Monthly Use of Selected Grid Capabilities Purdue Condor jobs Globus GRAM Jobs MyCluster CPUs MyCluster Jobs Globus GRAM Users Synchronous cross-site jobs January 2005 through December 2006
DAC Roaming Behavior 2006 321 DACs used resources EVER !! (only 37 before 2006) Analysis and Chart courtesy Dave Hart, SDSC
Real-Time Usage Mashup 521 Jobsrunning across12,090 processorsat 21:29:31 11/12/2006 December 4, 2006 500 jobs, 9400 processors Alpha version Mashup tool - Maytal Dahan, Texas Advanced Computing Center (maytal@tacc.utexas.edu)
Grid Service Usage (PreWS GRAM) Daily INCA Reporter (http://tinyurl.com/23ugbm) courtesy Kate Ericson, SDSC
Daily GT4 WS Invocation Reports Graph courtesy Tony Rimovsky, NCSA