Using NWEA MAP to Support Instruction 2010-11
770 likes | 1.09k Views
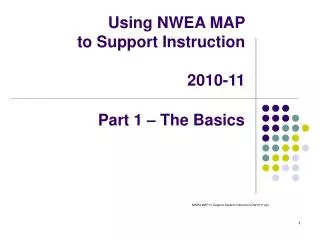
Using NWEA MAP to Support Instruction 2010-11. NWEA MAP to Support Student Instruction.DW1011.ppt. Part 1 – The Basics. Overview of Part 1. A Year of Assessment – Where NWEA Fits In Logging in and managing passwords Using the MAP Teacher Report Individual Student Progress Report

Using NWEA MAP to Support Instruction 2010-11
E N D
Presentation Transcript
Using NWEA MAP to Support Instruction 2010-11 NWEA MAP to Support Student Instruction.DW1011.ppt Part 1 – The Basics
Overview of Part 1 • A Year of Assessment – Where NWEA Fits In • Logging in and managing passwords • Using the MAP Teacher Report • Individual Student Progress Report • Student Goal-Setting Worksheet • Looking at Specific Skills (Descartes Continuum) • Using the Lexile Measure • Managing Your Own Further Learning • Preview of Part 2
1.A Year of Assessment – Where NWEA Fits In State Test (STAR)Mostly summative District Benchmark (NWEA)Formative and summative ClassroomFormative ClassroomFormative Classroom AssessmentsMostly formative ClassroomFormative The School Year Nearly all assessments can be used both formatively (to shape instruction) and summatively (to evaluate instruction). STAR is mostly summative, and classroom assessments are mostly formative. As the District Benchmark, NWEA can also be used for both purposes.
Why do NWEA? • Adapts to each student’s instructional level, giving more information about the student’s specific skills, and also making it more engaging for the student. • Provides a stable measure of growth which can be tracked within the school year, and from year to year. • Helps students set individual learning goals, thus motivating their own learning.
2. Logging In and Managing Passwords • Open Firefox (Mac or PC) or Internet Explorer (PC). Safari not recommended. • Go to www.nwea.org and click the words which say “Reports Login.”
Logging In and Managing Passwords Bookmark the login page. Then enter your User Name and Password. • “User Names” for teachers look like this: Joeteacher13456938. • We are not able to change them, but Firefox should remember them. • “Passwords” look like this:Rtby7Bm. They can be changed to something easier to remember if you wish. • Make it at least 6 characters, include both an upper and lower case letter, and one digit (number).
Logging In and Managing Passwords Left side navigation bar In the left side navigation bar, find the “Change Password” command. On the screen which comes up (not shown here), you will enter your chosen, new password twice. Then your new password will be set.
3. Using the MAP Teacher Report In the left side “navigation bar,” select “Teacher Reports.”
Using the MAP Teacher Report Use the dropdown menu to select the testing term (Fall 2010). Click the button which says “View by Goal Descriptors.” Click “Submit”
Sidebar: Displaying the Teacher Report in “pdf” using Adobe Reader • On some computers, the Teacher Report will not display immediately. The computer may ask how to display the file. • In this case, you will have to navigate to, and open, Adobe Reader, and choose it as the program to display your NWEA reports. • Once set, you should not have to keep doing this each time.
Sidebar: Displaying the Teacher Report in “pdf” using Adobe Reader Click here
Sidebar: Displaying the Teacher Report in “pdf” using Adobe Reader 1. Find “Applications” on your hard drive. It may open automatically. 2. Select Adobe Reader 3. Click here
Sidebar: Displaying the Teacher Report in “pdf” using Adobe Reader Be sure Adobe Reader is highlighted. Then click here
Sidebar: Displaying the Teacher Report in “pdf” using Adobe Reader Now Adobe Reader shows here Click this box to set it for the future Finish by clicking here
Sidebar: Displaying the Teacher Report in “pdf” using Acrobat Reader At some point in the process, you may also see a screen that looks like this. If you do, just click on the word “Cancel.” Then go back to the NWEA “Teacher Report” screen and click “Submit” again, and follow the directions on the previous slides to set Adobe Reader.
Using the MAP Teacher Report The report will show all your “rostered” students, so at secondary, each teacher will see both Reading and Math reports. Use the blue arrows to scroll through your reports. (On a Mac, they may be in a different spot.) Be sure that you are looking at the correct report (Reading or Math.) Sample Data
Using the MAP Teacher Report Terms to understand: RIT Standard error RIT Range %-ile %-ile Range Lexile Range GoalPerfor-manceArea InfoStruct &Critique Sample Data
Sidebar Definitions: RIT The RIT score, or “Rausch unIT,” is named for a Danish mathematician. It is a scaled score that goes from about 140-250. • For example, in Reading, the average RIT in Fall of Kindergarten is about 146, and the average RIT in the Spring of Grade 10 is about 225.
Sidebar Definition: Standard Error of Measurement and RIT Range • A number of factors which affect test performance, such as the test taker’s health, emotional state, motivation, rapport with the examiner, recent practice in the area being tested, attention, coordination, memory, fatigue, luck in guessing. • To account for this, any test score is made up of the tester’s “true” score, plus an “error” score. In NWEA the “error score” is usually 3-4 points, based on the student’s pattern of right and wrong answers compared to his/her final RIT score. • NWEA displays this on the Teacher Report by showing the “RIT Range” (RIT score plus or minus “one standard error”), which means that the true score falls within the RIT range 68% of the time.
Sidebar Definition: %-ile, and Norm vs. Criterion Referenced • “%-ile” refers to the percentile in the national norm group. For example, a student at the 61st percentile is scoring at or above 61% of the students in NWEA’s national sample of 2.8 million students. • A norm referenced test gives “%-ile” scores. A criterion referenced test, like STAR, gives levels of achievement (advanced, proficient, basic, etc.) based on actual skills a student has achieved, rather than comparison to a group of other students. • NWEA gives both.
Sidebar Definitions: Lexile Range • The Lexile Range, which appears on the NWEA Teacher Report for Reading, is a readability index which runs from BR (“beginning reader”) to about 1700. It is shown in NWEA reports as a 150-point range. • There is no exact equivalent for a grade level, but some familiar works: Frog and Toad are Friends is lexile 400, Black Beauty is 1000, The Scarlet Letter is 1400.
Sidebar Definitions: Informational Structures and Expository Critique • What are “Structural features of informational materials”? • In Gr. 2, this begins with using table of contents and chapter headings to find info. It adds complexity through Gr. 4, but never is more than 1-2 questions on CST (part of Reading Comprehension). • Beginning in Gr. 5, this area adds complexity and includes things like distinguishing between various different types of reading matter, and understanding compare-contrast, cause and effect, etc. It also assumes much more importance and becomes approx. 1/4 to 1/3 of the CST Reading Comprehension score.
Sidebar Definitions: Informational Structures and Expository Critique • “Expository Critique” appears in the CA E/LA Standards in Gr. 5-10. • In Gr. 5, where this is first seen, it begins with distinguishing fact and opinion. It gains complexity and importance in higher grades, and goes into noticing bias and stereotyping, and the credibility of an author’s argument. It also becomes approx. 1/4 to 1/3 of the CST Reading Comprehension score. • In most grade levels 5 and up, Structural Features and Expository Critique make up more than half of the Reading Comprehension score on the CST. • Bottom Line: Gr. 2-4 shouldn’t focus much on “Info Struct & Expos Critique.” Gr. 5-10 MUST focus on it as part of Reading Comprehension.
Sample Data 1. Most students have a combination of highs and lows in their Goal Areas (Clusters). 2. More newconcepts explained on next slides.
Sidebar Definitions: Mean RIT and Median RIT • The median is the “middle score,” half of the class being above it, and half below. It is the best measure to use for a single class of 20-40 students, so that a few very high or low scores won’t change it. • Mean is the arithmetic average. It is the best measure for a grade level or a whole school or district, where there are a large number of scores that won’t be changed much by a few high or low “outliers.”
Sidebar Definition: Standard Deviation • This is a measure of the “spread” of scores, showing how widely they cluster around the average score. The smaller the standard deviation, the more closely the scores are clustered round the mean. • For NWEA, a full class Standard Deviation of 10-15 is about normal. • Higher than 15 is quite varied, and will probably require some form of differentiated instruction. Lower than 10 is fairly homogeneous.
Sample Data Most students have a combination of highs and lows in their Goal Areas (Clusters). “Spread” of class (10-15 is normal.) The “median RIT scores” have significance. +/- 3 points from the Overall score indicates possible strength or an area of concern.
Handout: 2008 Normative Data Shaded items based on less than 1,000 students, interpret with caution (take with “a grain of salt.”)
Handout: California Proficiency Tables Hecka easy Italics for Gr. 2 represent extrapolated data Hella hard
Handout: California Proficiency Tables Easier Italics for Gr. 2 represent extrapolated data Harder
Sample Data Below: Nat’l mean CA Prof CA Basic Most students have a combination of highs and lows in their Goal Areas (Clusters). “Spread” of class (10-15 is normal.) Above: CA Advanced The “median RIT scores” have significance. +/- 3 points from the Overall score indicates possible strength or an area of concern.
Sample Data “Spread” of class (10-15 is normal.) The “median RIT scores” have significance. +/- 3 points from the Overall score indicates possible strength or an area of concern. Can you identify current strengths and areas of concern for this class?
4. Individual Student Progress Report To find an individual student’s test history, which allows you to see growth over time, click on “Class Rosters”
Individual Student Progress Report Use the “Select Term” dropdown menu to choose the test term you want (in this case Fall 2010). Use the “Select Class” dropdown menu to choose the section you want (secondary only) Select which “pair of test terms” you want. In this case, we will look at Fall to Fall. In Spring, do Fall to Spring. Not available for Winter. Select “both” for report type. You can click on your class name to generate reports for the entire class… or on one student at a time to see a report for only that student. Student names are listed below in this area.
Individual Student Progress Report This report shows how the student’s scores have moved over time. It also shows each student’s growth compared to typical growth. (But note growth will not show in Winter Term reports.)
Individual Student Progress Report Note that the vertical axes may not always show the same RIT levels.
A Tale of Two Students . . . Student 1 Student 2 These two students began 7th grade scoring almost the same in NWEA Reading. Student 1’s scores went up from 214 in fall to 221 in spring (although they were a little “up and down”), and met the NWEA growth goal. Student 2’s scores went down from 216 to 213, and did not meet NWEA growth goal. In Spring 2008, Student 1 scored Advanced on CST/ELA, and Student 2 scored Basic on CST/ELA.
. . . And a Third, Showing Growth Over Several Years Student 3 This student has shown consistent growth in NWEA Reading. In Spring 2005, this student scored Basic on the Gr. 5 CST/ELA. In Spring 2007, this student scored Proficient on the Gr. 7 CST/ELA. (These two CST ELA tests are of somewhat comparable difficulty, unlike those in some other grades.) This student was served in the Resource Specialist Program (Special Education).
5. Student Goal Setting Worksheet Click on “Dynamic Reports”
Student Goal Setting Worksheet Click again on the words “Dynamic Reports” in grey box.
Student Goal Setting Worksheet Click on “Student Goal Setting Worksheet.”
Student Goal Setting Worksheet 1. Use the dropdown menu to select the term pair: “Fall 10 – Spring 11.” This is very important to get the correct goal for each student. 2. Click the button “Limit by Class.” 3. Click “Run Document.”
Student Goal Setting Worksheet 1. Highlight the class you want (secondary only) 2. Click on the little arrow to move the section into the box on the right. 3. Click on “Run Document.”
You have now generated a Goal Setting Worksheet for every student in your section. Student selects goal from suggested growth. Print in “pdf” format. Strength shown in bold, area of concern shown in italics. “Action Plan” has a few lines to describe next steps Note: This report may not line all the data up on screen, but it will do so when printed.
6. Looking at Specific Skills and the Descartes Continuum To identify specific skills on which a student or a class may want to focus, select “Class by RIT.”
Looking at Specific Skills 1. Choose the test term (“Fall 2010”) 2. Use the dropdown menu to select the class you want (secondary only) 3. Click “Submit.”
Looking at Specific Skills This screen shows the skill spread of students in this section. To see more, click on the words “Mathematics” or “Reading.” SAMPLE DATA This report can be used two ways: to support whole class instruction, or to focus on the needs of individual students or small groups.