Download
1 / 30
300 likes | 321 Views
This article presents the findings of various studies conducted on AR 10930, including sunspot rotation, filament rotation, and changes in the magnetic field configuration. The results suggest a close relationship between sunspot rotation and the dynamic development of emerging twisted magnetic fields.

E N D
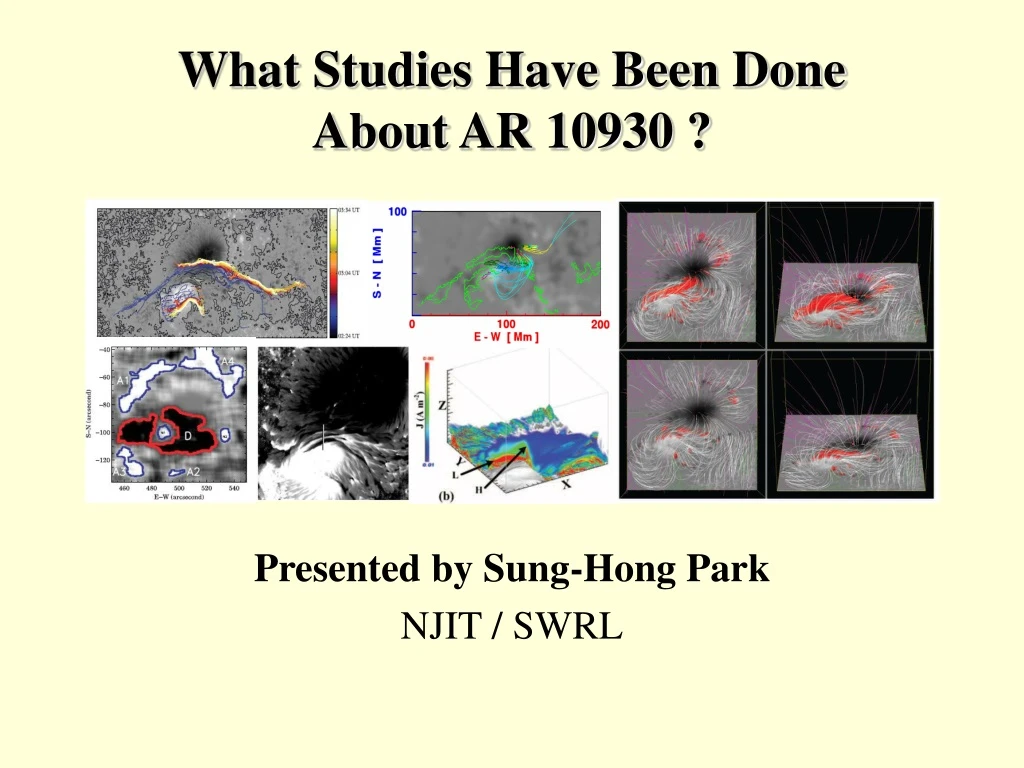
What Studies Have Been Done About AR 10930 ? Presented by Sung-Hong Park NJIT / SWRL
Published Papers ( more than 27 ) SWRL Group Meeting
Published Papers ( continued ) SWRL Group Meeting
Overview of NOAA 10930 Hinode/FG/G-band Hinode/FG/Ca II H Hinode/FG/Stokes-V LASCO/C2 Hinode/XRT LASCO/C2 BBSO/H-alpha Hinode/EIS SWRL Group Meeting
Summary i) The small sunspot of positive polarity rotated counterclockwise about its center by 540° during the period of five days. ii) Its angular velocity varied with the azimuth angle as well as the radial distance, being affected by the asymmetric shape of the umbra. iii) The angular velocity increased up to 8° h-1 until 13 December as the sunspot grew, and then decreased rapidly down to 3° h-1 on the next day as the sunspot decayed. iv) The coronal loops that connected the two sunspots became sigmoidal in shape. v) The coronal emissions (Hinode/EIS Fe XII) from the regions around the rotating sunspot were blueshifted, which may indicate the expansion of the coronal loops. vi) Our results suggest that the rotation of the sunspot may be closely related to the dynamic development of emerging twisted magnetic fields. 1. Sunspot Rotation/Motion Non-linear Affine Velocity Estimator (NAVE) technique by Chae & Sakurai (2008) was used to measure apparent motions from the co- aligned images. a) Min et al. (ApJ/2009) Radius (arcsec) = 0.22km/s Azimuth Angle (deg) Date (day) Hinode/FG/G-band SWRL Group Meeting
Hinode/SOT/SP Continuum Hinode/SOT/SP/ Vector Magnetogram 1. Sunspot Rotation/Motion b) Yan et al. (RAA/2009) SWRL Group Meeting
MDI TRACE 1600Å TRACE cont. TRACE 195Å 1. Sunspot Rotation/Motion Summary i) From December 11 at 12:51 UT, we find that the opposite polarities of ephemeral regions (ERs) emerge along the neutral line of AR 10930. ii) ERs are ellipses in shape and separate each other with a speed of 0.5 km/s. iii) The interaction between ephemeral regions and fast rotation of a sunspot plays a decisive role in producing the global instability responsible for this major solar event. c) Zhang et al. (SoPh/2009) = 0.22km/s SWRL Group Meeting
1. Sunspot Rotation/Motion Large-scale sunspot motion (center-of-mass separation) associated with the flare d) Wang et al. (ApJ/2008) Shear De-Shear Diverging Converging = 0.22km/s Converging SWRL Group Meeting
1. Sunspot Rotation/Motion Comparison with Coronal Magnetic Helicity = 0.22km/s SWRL Group Meeting
Derived from the potential field 1. Sunspot Rotation/Motion Lorentz force at the photospheric surface in an untwisted Sunspot Model (Parker, 1979) e) Su et al. (SoPh/2008) Non-Potential Magnetic Stress (NPMS) SWRL Group Meeting
2. Filament Rotation Summary i) We measure Doppler shifts with apparent velocities of up to 20 km/s, which are antisymmetric about the filament axis and occur several minutes before the flare’s impulsive phase. ii) This is indicative of a rotation of the filament, which is in turn consistent with expansion of a twisted flux rope due to the MHD helical kink instability. EUV spectroscopic observations of an AR filament before the X4.3 flare in the He II (256.32Å) line a) Williams et al. (PASJ/2009) SWRL Group Meeting
Penumbral flow derived from the LCT velocity of G-band images A1 A2 Shear flow derived from the LCT velocity of G-band images with overlapped Stokes –V images to distinguish the positive and negative polarities 3. Photospheric Flow a) Tan et al. (ApJ/2009) SWRL Group Meeting
with respect to the line-of-sight E-W (0° or 180°) χ => cos (2χ) N-S (90° or 270°) 4. Magnetic Field Line Configuration Changes a) Kubo et al. (PASJ/2007) Related to a trigger mechanism ? SWRL Group Meeting
Magnetic shear is defined as the azimuth difference between the extrapolated NLFF field and the potential field. 4. Magnetic Field Line Configuration Changes b) Jing et al. (ApJ/2008b) SWRL Group Meeting
Free Energy Shear Angle 4. Magnetic Field Line Configuration Changes & 7. Magnetic Free Energy c) Guo et al. (ApJ/2008) SWRL Group Meeting
4. Magnetic Field Line Configuration Changes d) Minoshima et al. (ApJ/2009) HXR sources are located where the change of direction of the horizontal magnetic fields is the most clearly seen. SWRL Group Meeting
5. Electric Current a) Wang et al. (ApJ/2008) Absolute value of electric current density in the channel structure at 12:00 UT on December 13 SWRL Group Meeting
Before After Before |jz| |jz| |jt| |jt| After jz jz 5. Electric Current b) Schrijver et al. (ApJ/2008) SWRL Group Meeting
6. Flare Ribbon & Reconnection Rate 1. Quantitative Estimate of the Coronal Magnetic Reconnection Rate in the Reconnecting Current Sheet (Forbes & Priest 1984 and Qiu et al. 2002) a) Jing et al. (ApJ/2008a) Vr: ribbon separation-velocity, Bn: the normal component of the local magnetic field strength measured in the ribbon location, dl : the length along the ribbons, da : the newly brightened area swept by the ribbons 2. Electric Field at the Reconnecting X-point 3. Magnetic Energy Release Rate (Isobe et al. 2002) SWRL Group Meeting
6. Flare Ribbon & Reconnection Rate 1. Quantitative Estimate of the Coronal Magnetic Reconnection Rate in the Reconnecting Current Sheet (Forbes & Priest 1984 and Qiu et al. 2002) a) Li et al. (A&A/2009) Vr: ribbon separation-velocity, Bn: the normal component of the local magnetic field strength measured in the ribbon location, dl : the length along the ribbons, da : the newly brightened area swept by the ribbons SWRL Group Meeting
Reversal Effect ?? or Real Helicity Sign Change ?? Hartkorn & Wang (2004) have pointed out that the reversal effect that can disturb MDI magnetic field measurements may also lead to impulsive changes of dH/dt during the flaring time. 8. Magnetic/Current Helicity a) Zhang et al. (ApJ/2008) Summary i) We find that there is a sharp jump of dH/dt around the onset and quench of a microwave burst at a frequency of 2.84 GHz: the rate of dH/dt changes from negative to positive around the start of the eruption and recovers to negative when the eruption stopped. ii) Furthermore, the temporal profile of dH/dt is consistent with that of a microwave burst. These results indicate that sharp variations of dH/dt are closely related to the solar eruption. SWRL Group Meeting
8. Magnetic/Current Helicity Magnetic Helicity injected via shear motions of a uniformly sheared arcade with the size of L and a flux of Φ Self-Consistent Shear Flow based on “Flux-Emergence Model” b) Magara & Tsuneta (PASJ/2008) SWRL Group Meeting
A proxy of the local twist of the magnetic field Bt α hc z-component of the current helicity density α hc 8. Magnetic/Current Helicity c) Su et al. (ApJ/2009) Summary i) The patches of positive and negative helicities were intermixed showing a mesh pattern in the umbra and a thread pattern in the penumbra. ii) For its main stable sunspot (MSS), there was a positive-helicity patch accounting for ∼43% of the umbra area surrounding the inner umbra, which had a predominantly negative helicity. For its minor rotating sunspot (MRS), there was a negative-helicity patch appearing in the umbra. iii) The fine distributions of αzand hcon a penumbral filament indicated that it may be possible for the two opposite helicities to coexist in a filament and their magnitudes were nearly equivalent. SWRL Group Meeting
Structure Function (Frisch 1995) Kinetic vorticity Flatness Function |ω2| characterizes the dissipation rate of kinetic energy in the photosphere caused by random motions of the footpoints of magnetic flux tubes. In the spatial domain, intermittency index ĸ implies a tendency of the magnetic field to concentrate into small-scale flux tubes of high intensity, surrounded by extended areas of much weaker field. In the temporal domain, intermittency is evidenced through a burstlike behavior of events. XRT SOT/FG GOES NoRH 9. Intermittency Summary i) The intermittency of the photospheric magnetic field peaked after the specific kinetic vorticity of plasma flows in the active region reached its maximum (4 hr time delay). ii) A gradual increase of coronal intermittency occurred after the peak of the photospheric intermittency. iii) The time delay between the peak of photospheric intermittency and the occurrence of the first strong (X3.4) flare was approximately 1.3 days. iv) Our analysis seems to suggest that the enhancement of intermittency/complexity first occurs in the photosphere and is later transported toward the corona. a) Abramenko et al. (ApJ/2008) SWRL Group Meeting
10. Coronal Nonthermal Velocity a) Harra et al. (ApJ/2009) EIS Fe XII Vnt SWRL Group Meeting
12. White-Light Flare a) Isobe et al. (ApJ/2007) Summary i)Assuming that the leading edge (kernels) was heated directly by nonthermal particles beams, and the diffuse parts were heated heating by radiative back-warming, We found that the layer of diffuse emission is about 100km below the height of the irradiation source. ii) Our result indicates that the height of the diffuse component, which we believe to be due to radiative back-warming, is also in the upper or middle chromosphere as that of the irradiation source. SWRL Group Meeting
Data samples observed by Jess et al. (2008) Peak Contrast Iois the local intensity before the flare and I is the intensity at the observed peak of the flare. The pre-flare image is taken between 2 to 4 minutes before the time of the flare peak. The equivalent area is the contrast integrated over the flare area, in units of arcsec2. 12. White-Light Flare b) Wang et al. (RAA/2009) Summary i) We found that the cut-off visibility is likely around M1 flares under the Hinode observing conditions. ii) WLF kernels are found inside sunspots. No kernel in the quiet areas of the sun was detected. iii) We speculate that the disk position of flares affects the visibility of WLFs. The events closer to the limb would have a better chance to have observed whitelight emissions, consistent with the comparison of Xu et al. (2006). SWRL Group Meeting
2006 December 6 13. Radio Emission a) Kaufmann et al. (SoPh/2009) Summary i) The sub-THz impulsive component had its closer temporal counterpart only in the higher energy X- and γ-rays ranges. ii) The spatial positions of the centers of emission at 212 GHz for the first flux enhancement were clearly displaced by more than one arcminute from positions at the following phases. iii) The observed sub-THz fluxes and burst source plasma parameters were found difficult to be reconciled to a purely thermal emission component. SWRL Group Meeting
2006 December 13 RHESSI 35-100keV NoRH 34 GHz 13. Radio Emission & 15. HXR Emission NoRH 34 GHz Negative image a) Minoshima. (SoPh/2009) Right (tick contours) and Left (dashed contours) Circular Polarization Summary i) Microwave images taken with the Nobeyama Radioheliograph show a loop structure connecting the HXR footpoint sources. ii) The brighter parts of the microwave intensity are located between the top and footpoints of the loop. iii) We consider these observations as evidence of electron acceleration near the magnetic separatrix and injection parallel to the field line. SWRL Group Meeting
2006 December 13 Pre-Flare vs. Post-Flare 2006 December 14 Pre-Flare vs. Post-Flare Summary i) XRT had detected two loop eruptions (likely filament eruptions), which started around 16:28 and 21:58 UT on December 12, respectively. ii) The magnetic configuration after the second loop eruption and 14 minutes prior to the December 13 flare is displayed in figure 4b, which is composed of several highly sheared loops. iii) After the December 13 flare onset, the post-flare loops gradually propagated from the highly sheared core field region to the outer and less-sheared envelope field region iv) Corresponding to the sheared core field observed by XRT, a filament is seen in TRACE prior to the December 13 flare (figure 4e). We still see most parts of the filament after the flare, as can be seen in figure 4f. Summary i) A filament eruption occurred around 16:40 UT on December 14. ii) A comparison of the figures shows that the filament corresponds to a highly sheared X-ray loop. iii) Figure 5b shows an X-ray image after the filament eruption and 30 minutes before the December 14 flare. We see no significant changes in the magnetic configuration before and after the filament eruption. iv) Similar to the December 13 flare, the post-flare magnetic configuration of the December 14 flare shows a highly sheared inside and less sheared outside structure (figure 5c) 14. Sheared SXR loop a) Su et al. (PASJ/2007) SWRL Group Meeting


