Download
1 / 32
320 likes | 343 Views
Explore the relationship between age structure and sustainability, focusing on pension systems, fertility rates, and population growth dynamics. Learn about support ratios in countries like Italy, Germany, and Spain, and long-term solutions for ensuring equilibrium. Understand the impacts of demographic transitions on environmental sustainability and population growth models.

E N D
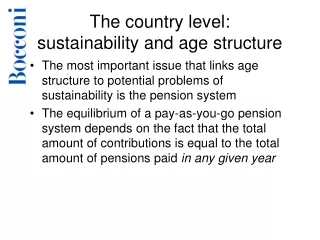
The country level:sustainability and age structure • The most important issue that links age structure to potential problems of sustainability is the pension system • The equilibrium of a pay-as-you-go pension system depends on the fact that the total amount of contributions is equal to the total amount of pensions paid in any given year
The country level:sustainability and age structure • Demographically, this depends on the stability of the ratio between population in working age and population in retirement age • ‘Support ratio’: how many persons aged 15-64 are there for a person aged 65 and over?
The country level:sustainability and age structure • If the support ratio decreases, solutions: • Increase retirement age • Increase labour force participation (i.e. of women) • Decrease level of pensions • Increase level of contributions • At the level seen, the development is not sustainable
The country level:sustainability and age structure • The main reason is the decrease in fertility • Second reason the increase in longevity
The country level:sustainability and age structure • “Lowest-low” fertility, defined when the average number of children per woman in a year (“period” TFR) drops below 1.3 has emerged in Europe in the 1990s (Kohler, Billari, Ortega, 2002) • Forerunners: Italy & Spain. Then Central & Eastern Europe, Former USSR
The country level:sustainability and age structure • Long-term sustainable solution: • Increase in fertility combined with • Increase in immigration • To be in equilibrium, TFR should be close to 2.1 (e.g. 1.8) and immigration compensate for the difference (close to U.K., U.S. solution) • Of course, in the meanwhile medium- short-term solutions
The global level • World’s population is at a level that has never been reached in the past • Today’s counts are pretty close to 6.4 billion individuals (U.S. Census Bureau World Population Clock) • Is population a “bomb”?
The global level Billions 12 11 2100 10 9 Modern Age Old 8 Iron Middle Bronze Stone Age New Stone Age Ages Age Age 7 Future 6 2000 5 4 1975 3 1950 2 1900 1 1800 Black Death — The Plague 2000 1+ million 7000 6000 5000 3000 1000 A.D. 4000 A.D. A.D. A.D. A.D. A.D. years B.C. B.C. B.C. B.C. B.C. B.C. B.C. 1 1000 2000 3000 4000 5000
The global level • Maybe pure growth problems are not the most relevant ones for the future • The demographer Wolfgang Lutz and colleagues in 2001 (‘Nature’) proclaimed ‘The end of world population growth’
Modeling population dynamics • Population dynamics can be modeled in simple but meaningful and didactical ways • Exponential growth • Logistic growth • Logistic growth with time-varying carrying capacity
Exponential growth • T.R. Malthus (1766-1834) • 1798: An Essay on the Principle of Population • “…the human species would increase in the ratio of -- 1, 2, 4, 8, 16, 32, 64, 128, 256, 512, etc. and subsistence as -- 1, 2, 3, 4, 5, 6, 7, 8, 9, 10, etc.”
Exponential growth • The “Population Bomb”
Logistic growth • Back to Malthus (a different reading): • “…That population cannot increase without the means of subsistence is a proposition so evident that it needs no illustration...” • Pierre Verhulst (1845): logistic growth. Population cannot grow above a certain level (‘carrying capacity’)
Logistic growth (discrete time) • Explicit modeling of the carrying capacity (K) • Limits to growth • K is an asymptote • Note: potential chaotic dynamics (Robert May, ‘Nature’, 1976)
Logistic growth with time-varyingcarrying capacity • The realism of the model can be improved, including ‘demographic transitions’ • K may vary over time because e.g. of innovation
Deevey’s (1960) graph(Scientific American – note the log scale)
Modeling environmental impact and population • Paul Ehrlich and John Holdren (1971), “Impact of Population Growth”, Science; also Barry Commoner • IPAT Model
I=PAT • Environmental impact (I) is a function of: • Population (P) • Affluence (A) • Technology (T) • In fact, • A is usually expressed as production per capita (Y/P) • T is usually expressed as impact per unit of production (I/Y)
I=PAT • This model can be used to decompose the role of the three factors (P, A, T) in shaping environmental impact • E.g. Energy use • Technology (& technology transfers) are the keys to reduce environmental impact!
Bibliography • Joseph A. McFalls Jr., 2003, Population: a lively introduction, Population Bulletin, 58, 3, Population Reference Bureau, Washington D.C. • Massimo Livi Bacci, 2001, A Concise History of World Population, Blackwell Publishing, Malden • World Commission on Environment and Development, 1987, Our Common Future, Oxford University Press, Oxford • Luis Rosero-Bixby & Alberto Palloni, 1998, Population and Deforestation in Costa Rica, Population and Environment, 20: 149-185 • Richard Jackson & Neil Howe, 2003, The 2003 Aging Vulnerability Index, Center for Strategic and International Studies and Watson Wyatt Worldwide, Washington, D.C.
Bibliography • Kohler, Hans-Peter, Francesco C. Billari & José Antonio Ortega, 2002, The Emergence of Lowest-Low Fertility in Europe During the 1990s, Population and Development Review 28: 641-680 • Wolfgang Lutz, Warren Sanderson & Sergei Scherbov, 2001, The end of world population growth, Nature 412: 543-545 • Robert May, 1976, Simple mathematical models with very complicated dynamics, Nature 261: 459-467 • Edward S. Deevey Jr., 1960, The Human Population, Scientific American 203: 194-204 • Paul R. Ehrlich & John P. Holdren, 1971, Impact of population growth, Science 171: 1212-1217 • F. Landis MacKellar, Wolfgang Lutz, Christopher Prinz & Anne Goujon, 1995, Population, Households and CO2 Emissions, Population and Development Review 21: 849-865