Download
1 / 48
490 likes | 784 Views
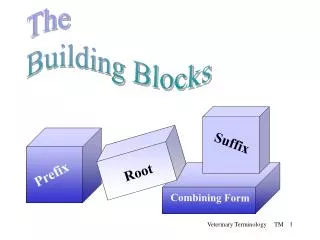
Project Scheduling. Reviewing “The Building Blocks”. Defining the Critical Path. The Critical Path The Sequence of Tasks that takes the Longest to Complete Defines Duration of the Project Determines the End Date of the Project

E N D
Project Scheduling Reviewing“The Building Blocks”
Defining the Critical Path • The Critical Path • The Sequence of Tasks that takes the Longest to Complete • Defines Duration of the Project • Determines the End Date of the Project • The Overall Duration of the Project Cannot be Reduced without shortening the Critical Path
Critical Path • Free Float • The Amount of Extra Time the Task can be Delayed or Extended without Affecting the Start of a Successor task • Total Float • The Amount of Extra Time the Duration of the Task can Expand without Affecting the Project End Date • Negative Float • Negative Total Float is the Amount of Time by which a Critical Task Misses its Required Date
The Gantt Chart Gantt Chart Overview The Gantt Chart Displays the Project Schedule in a Time Phased Format The Gantt Chart Indicates: • Start & End Dates • Task Durations • Float • Baselines • Task Completion & Status • Parallel Activities • Major Project Events
WSDOT Project Scheduling • Who are the “players?” • What do we use a project schedule for? • The Project Delivery Information System (PDIS) • The WSDOT Master Deliverables List (MDL) • Working with the MDL (Task Planning)
The Project Schedule Your “road map” for getting from here to there. What information can we get from the schedule? What tasks will be done Who will do them How long will they take What sequence will they be done How much will they cost “You got to be careful if you don’t know where you’re going, because you might not get there.” -Yogi Berra
WSDOT Project Scheduling • Who are the “players?” • What do we use a project schedule for? • The Project Delivery Information System (PDIS) • The WSDOT Master Deliverables List (MDL) • Working with the MDL (Task Planning)
WSDOT Project Scheduling • Who are the “players?” • What do we use a project schedule for? • The Project Delivery Information System (PDIS) • The WSDOT Master Deliverables List (MDL) • Working with the MDL
Master Deliverables List (MDL) Level 1 Construction Pre-Construction Phase Level 2 Processes Level 3 Deliverables Level 4 Deliverables (in some cases) Level 5-10 Tasks
Team Mission Scheduling Terminology • Work Breakdown Structure (WBS) • A deliverable oriented hierarchical decomposition of the work to be executed by the project team to accomplish the team mission and create the required deliverables. The WBS defines the project scope.
Team Mission Scheduling Terminology • Deliverable • Any unique and verifiable product or result that must be produces to complete a project. Usually the lowest level of the WBS.
Team Mission WBS (Scope) Task 1 Task 2 (Etc.) Task 1 Task 2 (Etc.) Task 1 Task 2 (Etc.) Task 1 Task 2 (Etc.) Task 1 Task 2 (Etc.) Task 1 Task 2 (Etc.) Activity List (Schedule) Scheduling Terminology • Scheduled Activity (task) • A component of work performed to create a deliverable.
Master Deliverables List (MDL) Example (Preconstruction) PC Level 1 (Project Phase) (Hydraulics) PC - 25 Level 2 (Process) (Type B Report) PC-25 . 02 Level 3 (Deliverable) Levels 4-10 (Tasks & sub tasks) (Assignable Tasks) PC-25.02 . 01 PC-25.02 . 02 etc…
WSDOT Project Scheduling • Who are the “players?” • What do we use a project schedule for? • The Project Delivery Information System (PDIS) • The WSDOT Master Deliverables List (MDL) • Working with the MDL
Working with the MDL • Process of Elimination • Preferential Re-ordering • By “family” • WBS completion – “sufficiency” • Define tasks (levels 4 – 10) • Task Planning • Network (precedence) Diagram • Gantt Chart
Master Deliverables List (MDL) Level 1 Construction Pre-Construction Phase Level 2 Processes Level 3 Deliverables Level 4 Tasks (Deliverables in some cases) Level 5-10 Sub-Tasks
Type B Report Task Planning Worksheet
Type B Report PC-25.02 Prepare Hydraulic Report Type B for Review PC-25.02.01 Prepare Hydraulic Report Type B according to the standards prescribed in the Highway Runoff Manual and Storm water Management Policy. Includes verification of existing drainage facilities on project site. When completed, report will be sent to Region Hydraulics Engineer for review and concurrence.
Defining Activities/Tasks • Definition • Assignment • Significance
Type B Report PC-25.02 Prepare Hydraulic Report Type B for Review PC-25.02.01 Prepare Hydraulic Report Type B according to the standards prescribed in the Highway Runoff Manual. Includes verification of existing drainage facilities on project site. When completed, report will be sent to Region Hydraulics Engineer for concurrence.
Task Planning Estimating Percent Complete • Is key to simplify schedule tracking and used to calculate EVM values for the project. • Methods to calculate percent complete: • Units Produced • Milestones (Agreement) Method • 50 – 50 Convention • 0 – 100 Convention • Proportional Relationships (hammock)
Task Planning Estimating Percent Complete • Units Produced • Ratio of units completed to the total planned • Units must be nearly identical • Examples: • Drilling 10 holes, 4 completed; 40% complete • Paving 5 lane miles, paved 4 lane miles; 80% complete
Task Planning Estimating Percent Complete • Milestone (Agreement) Method • At the onset of the project, agree with the project team members on percent complete of various stages of the process/deliverable. These points can be entered as interim schedule milestones for the deliverable. • Example: • Data Collection – 10% • Draft Traffic Signal Design – 70% • Final Traffic Signal Design – 90% • Traffic Signal PS&E – 100%
Task Planning Estimating Percent Complete • 50 – 50 Convention • The 50 – 50 convention is best used when an accurate estimate is nearly impossible and when durations are relatively short (less than the reporting frequency). • This method is a good method for higher-level EVM and when there are several processes (or deliverables) to be evaluated. • The more tasks/deliverables evaluated, the more accurate the EVM. 50% complete is assumed when the task/deliverable has started. 100% complete is assumed when the task/deliverable is finished.
Task Planning Estimating Percent Complete • 0 – 100 Convention • The 0 – 100 convention is best used when a task/deliverable has no value unless it is completed and when durations are relatively short (less than the reporting frequency). • This method is also a good method for higher-level EVM and when there are several processes (or deliverables) to be evaluated. • 0% complete is assumed until a task/deliverable is complete. 100% complete is assumed when the task/deliverable is finished.
Task Planning Estimating Percent Complete • Proportional Relationship • This method is used when the completion of a measurable amount of one work package indicates the completion of another task that cannot be easily measured. • This method works well for the “on-going” or hammock tasks within the project schedule. • Example: • 40% of the project is complete, so 40% of the project management task is complete.
Type B Report PC-25.02 Prepare Hydraulic Report Type B for Review PC-25.02.01 Prepare Hydraulic Report Type B according to the standards prescribed in the Highway Runoff Manual. Includes verification of existing drainage facilities on project site. When completed, report will be sent to Region Hydraulics Engineer for concurrence. X
Task Planning Duration Estimating • Expert Judgment • Guided by historical information • “Top-down” estimating • Analogous Estimating • Using actual durations of a previous, similar schedule activity as basis for estimating duration of future schedule activity. • Uses expert judgment and historical information • “Top-down” estimating
Task Planning Duration Estimating • Parametric Estimating • Quantitatively determined by multiplying quantity of work to be performed by the productivity rate. • “Bottom-up” estimating
Task Planning Duration Estimating • Three-Point Estimates • Formerly called Program Evaluation and Review Technique (PERT) • Incorporates risk factors into estimate • Three types of estimates: • Most Likely (ML): Realistic expectations • Optimistic (O): Best-case scenario • Pessimistic (P): Worst case scenario • Typically provides a more accurate duration estimate than single point estimating.
(1 x O) + (4 x ML) + (1 x P) 6 (1 x 2.5) + (4 x 3.0) + (1 x 5.5) 6 Task Planning Duration Estimating Three-Point Estimates Task: Drive home from class (Yakima to Enumclaw ~ 160 miles) Most Likely: 3.0 hrs Optimistic: 2.5 hrs Pessimistic: 5.5 hrs = 3.33 hrs
Task Planning Duration Estimating • Three-Point Estimates • Formerly called Program Evaluation and Review Technique (PERT) • Incorporates risk factors into estimate • Three types of estimates: • Most Likely (ML): Realistic expectations • Optimistic (O): Best-case scenario • Pessimistic (P): Worst case scenario • Typically provides a more accurate duration estimate than single point estimating.
Type B Report PC-25.02 Prepare Hydraulic Report Type B for Review PC-25.02.01 Prepare Hydraulic Report Type B according to the standards prescribed in the Highway Runoff Manual. Includes verification of existing drainage facilities on project site. When completed, report will be sent to Region Hydraulics Engineer for concurrence. X 20d
Task Interdependencies Task Interdependencies Specify Task Relationships All tasks are Related To: • Other Schedule Activities • “Mandatory” or “Hard Logic” • “Discretionary” or “Soft Logic” • External Events • Dependent Dates • Required Dates Network Diagram
Team Mission WBS (Scope) Task 1 Task 2 (Etc.) Task 1 Task 2 (Etc.) Task 1 Task 2 (Etc.) Task 1 Task 2 (Etc.) Task 1 Task 2 (Etc.) Task 1 Task 2 (Etc.) Activity List (Schedule) Scheduling Terminology • Scheduled Activity (task) • A component of work performed to create a deliverable.
PC-24.10 – Roadway Sections FS PC-18.07.01 – Biological Evaluation FS TE 2 (Design) Effort 40h None TT 2 (Design) Effort 80h None
Master Deliverables List (MDL) Level 1 Construction Pre-Construction Phase Level 2 Processes Level 3 Deliverables Level 4 Deliverables (in some cases) Level 5-10 Tasks
$ Q R S Project TO (Organization Breakdown Structure - OBS) • Plan at Deliverable level • What (deliverable, constraints, standards) • How Much? • Duration $ponsor Sr. Mgmt. Project Manager ¦ Manager Team Member ¦Team Member Task Planning
Executive Order 1032.00 • …directs WSDOT employees to deliver capital transportation projects consistent with the principles and practices of the department’s project management process. • Further direction given to: • Executive Managers • Project Managers • Project Team Members • Specialty Groups • HQ Staff
Executive Order 1032.00 • Executive Order • … • D. Direction to Specialty Groups • 1. Provide the Project Manager with the schedule and estimate for the tasks assigned. • …
$ Q R S Project TO (Organization Breakdown Structure - OBS) • Plan at Deliverable level • What (deliverable, constraints, standards) • How Much? • Duration $ponsor Sr. Mgmt. Project Manager ¦ Manager Team Member ¦Team Member Task Planning
Working with the MDL • Process of Elimination • Preferential Re-ordering • By “family” • WBS completion – “sufficiency” • Define tasks (levels 5 – 10) • Task Planning • Network (precedence) Diagram • Gantt Chart (From PDIS)
WBS Code WBS Code WBS Code WBS Code WBS Code Activity Activity Activity Activity Activity Activity B Activity A Activity C Activity E Activity D Early Start (ES) Early Start (ES) Early Start (ES) Early Start (ES) Early Start (ES) Duration Duration Duration Duration Duration Late Start (LS) Late Start (LS) Late Start (LS) Late Start (LS) Late Start (LS) 7 5 3 3 2 Early Finish (EF) Early Finish (EF) Early Finish (EF) Early Finish (EF) Early Finish (EF) Late Finish (LF) Late Finish (LF) Late Finish (LF) Late Finish (LF) Late Finish (LF) Total Float (TF) = Total Float (TF) = Total Float (TF) = Total Float (TF) = Total Float (TF) = Simple Project consisting of 5 Tasks
Working with the MDL • Process of Elimination • Preferential Re-ordering • By “family” • WBS completion – “sufficiency” • Define tasks (levels 5 – 10) • Task Planning • Network (precedence) Diagram • Gantt Chart (From PDIS)
Work Breakdown Structure (WBS) Risk Planning Task Planning & Scheduling Budget Project Performance Baseline “Progressive Elaboration”