Download

1 / 11
120 likes | 305 Views
2-6 the three views of a function. Miss batTAGLIA – ALGEBRA 1 CP OBJECTIVE: GRAPH A FUNCTION; CREATE A TABLE OF VALUES FROM A RULE AND A GRAPH. WARM UP.

E N D
2-6 the three views of a function Miss batTAGLIA – ALGEBRA 1 CP OBJECTIVE: GRAPH A FUNCTION; CREATE A TABLE OF VALUES FROM A RULE AND A GRAPH.
WARM UP • A soccer player is preparing for a tournament by running 3 mi every day for 6 wk. The first week her run took 21 min and 40 s. Each week she trimmed 25 s off her time. How long did the 3-mi run take her during the last week?
Think about it… • Name different ways to represent this pattern using words, sketches, symbols, or any other mathematical method. • 3, 6, 9, 12, …
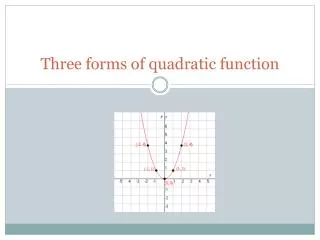
Three views of a function… • Rule Table of Values Graph
Suppose a car gets 30 mi/gal. Then the distance d(g) that the car travels is a function of the number of gallons g. • Rule Table of Values Graph • Suppose the car used 14 gal of gas. How far did it travel? • How did you find that answer? Describe another method.
example • Suppose you hire an electrician to install an electrical outlet. The electrician charges $68 for materials plus $40 an hour for service. The total cost C(h) is a function of the number of hours it takes to do the job. Use the rule C(h) = 68 + 40h to make a table of values and then a graph. Step 1: Choose values for h that seem reasonable Step 2: Input the values for h. Step 3: Plot the ordered pairs
Try it with a partner… • Model the rule with a table of values and a graph.
example Graph the function y = x2 – x - 6
Try it on your own… Graph the function y = -3x2 + 1
example • Make a table of values for the graph below.
Classwork/ homework • Pg86 #1–6 12, 14, 31