Download
1 / 32
330 likes | 498 Views
Diversity in Families. Ch. 2. Critical Thinking:. How do YOU define family? What assumptions are inherent in this definition? How do your experiences influence your understanding of family? How might social and cultural forces influence our understanding of family?. Defining Family.

E N D
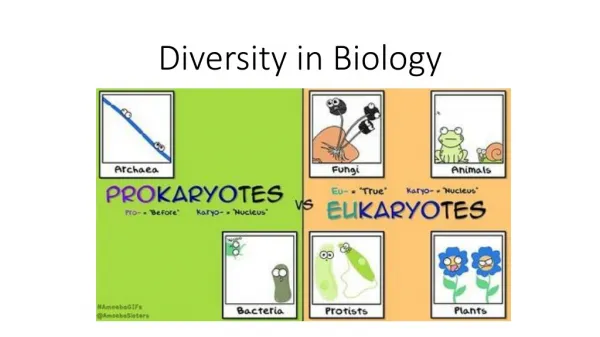
Diversity in Families Ch. 2
Critical Thinking: • How do YOU define family? • What assumptions are inherent in this definition? • How do your experiences influence your understanding of family? • How might social and cultural forces influence our understanding of family?
Defining Family • Traditionally, both law and social science have specified that the family consists of people related by blood, marriage, or adoption. • The U.S. Census Bureau defines a family as “a group of two or more persons related by blood, marriage, or adoption and residing together in a household.” • Many sociologists agree to define family as: Any sexually expressive, parent–child, or other kin relationship in which people—usually related by ancestry, marriage, or adoption—(1) form an economic and/or otherwise practical unit and care for any children or other dependents, (2) consider their identity to be significantly attached to the group, and (3) commit to maintaining that group over time.
What is a Family? • Your book: A group united by marriage, cohabitation, blood, and/or adoption in order to satisfy intimacy needs and/or to bear and socialize children.
Issues for Thought: Which of these is a Family? • A husband and wife and their offspring. • A single woman and her three young children. • An eighty-four-year-old widow and her dog, Fido. • A man and all of his ancestors back to Adam and Eve. • The 1979 World Champion Pittsburgh Pirates (theme song: “We Are Family”).
Family Functions Social scientists usually list three major functions filled by today’s families: • Raising children responsibly • Providing members with economic and other practical support • Offering emotional security
Family Structure Refers to the form a family takes, and varies according to the society in which it is embedded: • Extended Family • Nuclear Family • Postmodern Family
Extended Family • In preindustrial or traditional societies, the family structure involved whole kinship groups. • The extended family of parents, children, grandparents, and other relatives performed most societal functions, including economic production (e.g., the family farm), protection of family members, vocational training, and maintaining social order.
Nuclear Family • In industrial or modern societies, the typical family structure often became the nuclear family (husband, wife, children). • Until about fifty years ago, social attitudes, religious beliefs, and law converged into a fairly common expectation about what form the American family should take: breadwinner husband, homemaker wife, and children living together in an independent household—the nuclear family model.
Postmodern Family • The term postmodern family came into use in order to acknowledge the fact that families today exhibit a multiplicity of forms and that new or altered family forms continue to emerge and develop. • Today, family members are not necessarily bound to one another by legal marriage, blood, or adoption. • The term family can identify relationships beyond spouses, parents, children, and extended kin. Individuals fashion and experience intimate relationships and families in many forms. • As social scientists take into account this structural variability, it is not uncommon to find them referring to the family as postmodern (Stacey 1990).
Typical Families • Today, only 7% of families fit the 1950s nuclear family ideal of married couple and children. • Dual-career families are common, and there are reversed-role families (working wife, househusband). • There are many different family forms: single-parent families, stepfamilies, cohabiting heterosexual couples, gay and lesbian families, and three-generation families.
Types of Families • Today there are more single-parent families, gay partners and parents, remarried families, and families in which adult children care for their aging parents.
Variations in Families Single parent families Racial and ethnic minority families Same-sex families
Challenges of the Single-Parent Family Challenges of Single Parents Challenges of Children of Single Parents Problems between Parents and Children
Children Living With One Parent Sources: U.S. Census Bureau 1994:66; 2010a.
Ethnicity: • Ethnicity refers to cultural distinctions often based in language, religion, and history. • For U.S. Census purposes, there are two major categories of ethnicity: Hispanic and non-Hispanic. Race: • Race is a social construction reflecting how Americans think about different social groups. • The term race implies a biologically distinct group, but scientific thinking rejects the idea that there are races distinguished by biological markers. • The 2000 census used five major categories: • White • Black or African American • Asian • American Indian or Alaska Native • Hawaiian or Other Pacific Islander
Changes in America’s Race/Ethnic Composition • The United States is seeing greater and increasing racial and ethnic diversity. • Making up about one-third of the U.S. population today, racial and ethnic minorities are projected to reach 50% of the population by about 2042. • African Americans, Hispanics, American Indians, Asians, and Hawaiians and Other Pacific Islanders are often grouped into a category termed “minority group.” • This conveys the idea that persons in those groups experience some disadvantage, exclusion, or discrimination in American society as compared to the dominant group: non-Hispanic white Americans. • As a result, there is greater variation in the structure, form, and experience of family life.
Diversity in the United States • In 2008, the United States was: • 65.6% non-Hispanic white • 12% black • 4.3% Asian • Less than 1% American Indian/Alaska Native • Less than 1% Native Hawaiian and Other Pacific Islander • Hispanics are 15.4% of the population
Child Population • The child population of the United States is more racially and ethnically diverse than the adult population and will become even more diverse in the future.
Racial and Ethnic Minority Families The African-American Family The Hispanic Family The Asian-American Family The Pacific Islander Family The Native American Family The Arab American Family The White Family The Interracial/Multi-Ethnic Family
African American Families • Between 2007-2008, African American households saw their median income decline 2.8% to $34,218. • A higher proportion of black children than those of most other racial/ethnic groups lives in poverty (33.9%), although by 2008 more Hispanic children were living in poverty (39.6%). • 71% of births in 2007 were to unmarried mothers. • Divorce rates are higher as well • Black women are more than twice as likely as whites to suffer the death of an infant. • Only 35% of African American children are living with married parents, compared to 75% of white and 64% of Hispanic children. • In the 1960s, more than 70% of black families were headed by married couples. In 2008, only 31.1% were.
Latino (Hispanic) Families • Many Latinos are recent immigrants from Mexico, Central America, the Caribbean, or South America. • A majority of U.S. Latinos were born in this country, but 40% are foreign born. • Binational families are those in which some family members are American citizens while others are undocumented immigrants. • 28.3% of Latino children are poor, compared to 17.6% of all children. • Only 62.3% of Latinos graduate from high school and 13.3% from college. • Hispanics are most likely to be employed in service level occupations and to have higher rates of unemployment. • Tend to marry at young ages • Birth rates are the highest of any racial/ethnic group, but vary by within-group ethnicity. • Half of births to native-born Latinas in 2007 were to unmarried women. • Families are more likely to be extended and larger than those of non-Hispanic whites.
Asian American Families • Asian Americans are one of the fastest growing of all racial/ethnic groups. • Asian Americans have the highest proportion of college graduates, high representation in managerial and professional occupations, and family incomes that are the highest of all racial/ethnic groups. • A higher percentage of Asian Americans are married than among general population. • 85% of Asian American children are very likely to live in married-couple families. • Only 10% live in single-mother families, 2% in single-father families, and 2% live with neither. • Asian Americans are most likely of all groups to be caring for older family members. • More diversity exists among Asian Americans in terms of language, religion, and customs than in in other broad racial/ethnic group. • Discrimination against Asian Americans still exists, and Asian Americans are more likely than whites to be poor.
Pacific Islander Families • Major Pacific Islander groups in the U.S. are Native Hawaiians, Samoans, and Guamians. • Hawaiians are American citizens by birth, as are American Samoans, Guamians, and those born in the North Mariana Islands. • Relatively young population (median age is 29.8 years old); about 29% of the population are children • Just under half are married (47.4%). • Pacific Islander children are more likely to reside in family households (31.5%) than the U.S. population generally (21%). • Similar rates of marital stability as compared to non-Hispanic whites • Smaller proportion of college graduates • Median household incomes is slightly higher ($55,273 in 2007), and poverty is slightly higher (15.7%) than for the general U.S. population.
American Indian (Native American) Families • At present there are over 500 federally recognized tribes. • In the latter half of the 19th century, American Indians were forcibly removed from their original tribal lands to reservations, and some tribes were dissolved. • Assimilation policies led to the creation of boarding schools, where American Indian children were placed for years with little contact with family or tribe. • Significantly lower median income at $35,345 • One-third have incomes of more than $50,000. • Poverty rate is high—25.3% on average for the years 2006-2008. • Childhood poverty rate for all children under the age of 18 is 46.1% in female-headed families. • One of the poorest groups, with poverty rate highest among those living on reservations • High rates of adolescent births and nonmarital births • Infant mortality rate and childhood mortality rate are higher than overall U.S. rates. • Higher rate of cohabitation and lower percentage of married couples • In 2006, 51% of children lived with two parents.
Arab American Families • Arab American population is a little over 1.5 million. • Often the subject of media stereotyping and government suspicion • Have long been stereotyped as exotic, mysterious, and dangerous • After the terrorist attacks of September 11, 2001, Arab American families have been the subject of harassment, intimidation, vandalism, physical attacks, discrimination, and murder. • Family is very important, and Arab American families are often extended beyond American borders. • Religion is an important factor; 65% of Arab Americans are Christian. • Arab American women are employed at lower rates than other women. • Traditional gender roles are emphasized.
White Families • Non-Hispanic whites are the majority in the United States at 66% of the population. • The non-Hispanic white family appears more likely to be headed by a married couple and less likely to include family members beyond the nuclear family. • Older than other groups • Lower fertility rates • Higher incomes than all groups but Asians and lower poverty rates than all other racial/ethnic groups. • White women are less likely than black and Hispanic women to bear children as teenagers or to have nonmarital births. • In 2008, almost 73% of non-Hispanic white children lived with two parents.
Multi-Ethnic Families • 7% of married-couple households include spouses whose racial/ethnic identities differ. • 15% of opposite-sex partners and male same-sex partners and 13% of female same-sex partners report different racial/ethnic identities. • The proportion of multiracial children in the population is likely to grow with increasing intermarriage and perhaps a greater tendency to acknowledge a mixed racial/ethnic heritage. Multiracial families are formed through: • interracial marriage • formation of a nonmarital partnership • the adoption of children across racial lines
Same-Sex Couples and Family Life • In 2008, there were approximately 754,000 same-sex couple households in the U.S. • In the absence of access to legal marriage, partners may publicly declare their commitment in ceremonies among friends or in some congregations and churches. • Same-sex partners highly value love, faithfulness, and commitment (like heterosexual couples). • More equality and role sharing than in heterosexual marriages • Same-sex couples must daily negotiate their private relationship within a heterosexual (often heterosexist) world. • Discrimination adds stress and may result in lowered mental health and relationship quality.
Same-Sex Parents and Outcomes for Children • A national study of gay and lesbian parents found more similarities than differences between them and heterosexual parents. • gay and lesbian parents had, in a number of areas, more positive child-rearing practices: compared to heterosexual parents, they were more responsive to their children, more child oriented, and more egalitarian in sharing household tasks between the partners. • 2008 Census survey found 31% of same-sex couples who identified themselves as married and 17% of other same-sex households now include children under age 18. • Children of gay male and lesbian parents are generally well adjusted, with no noticeable differences from children of heterosexual parents in cognitive abilities, behavior, or emotional development. • No evidence that children are confused about their gender identity or that they are more likely to be homosexual.
Families and Historical Events • Historical events and conditions affect options, decisions, and everyday lives of families. • Changes in society over time have meant changes in how family is defined, experienced, and understood. • A historical perspective allows us to understand past and present social forces as they influence the family experience.