Download
1 / 48
480 likes | 689 Views
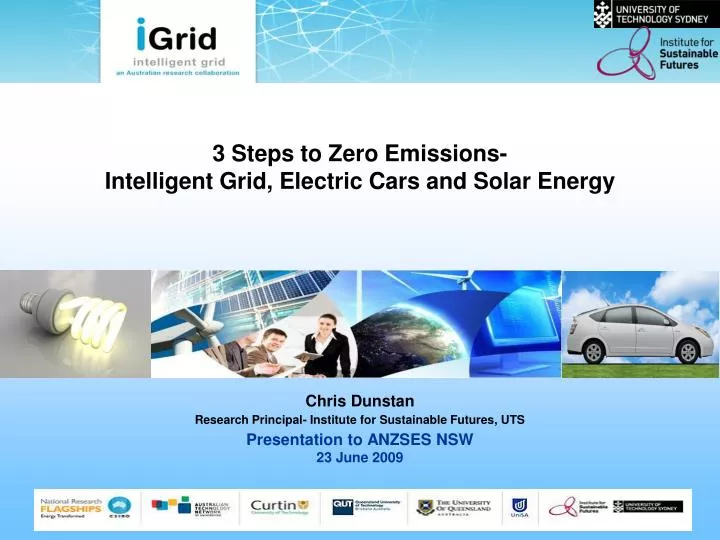
3 Steps to Zero Emissions- Intelligent Grid, Electric Cars and Solar Energy. Chris Dunstan Research Principal- Institute for Sustainable Futures, UTS Presentation to ANZSES NSW 23 June 2009. Summary. Intelligent Grid Research Program Network Investment: Bigger or smarter?

E N D
3 Steps to Zero Emissions- Intelligent Grid, Electric Cars and Solar Energy Chris Dunstan Research Principal- Institute for Sustainable Futures, UTS Presentation to ANZSES NSW 23 June 2009
Summary • Intelligent Grid Research Program • Network Investment: Bigger or smarter? • Australian Distributed Energy Roadmap • Electric Cars • Solar Energy
e.g. permanent Arctic ice may disappear by 2030 Reduced ice albedo (reflectivity) = positive feedback
... the melting of Greenland ice cap may become unstoppable and raise global sea level by 7 metres
International Climate Science Congress (Copenhagen March 2009)Key Messages: “1. Climatic trends: Recent observations show that greenhouse gas emissions and many aspects of the climate are changing near the upper boundary of the IPCC range of projections. Many key climate indicators are already moving beyond the patterns of natural variability within which contemporary society and economy have developed and thrived. These indicators include global mean surface temperature, sea-level rise, global ocean temperature, Arctic sea ice extent, ocean acidification, and extreme climatic events. With unabated emissions, many trends in climate will likely accelerate, leading to an increasing risk of abrupt or irreversible climatic shifts. climatecongress.ku.dk/pdf/synthesisreport
Elements of Intelligent Grid • Distributed Energy: • Peak Demand Management - DSR • Energy Efficiency • Distributed Generation • Energy Storage • Smart Meters, • Time of Use pricing • Real time displays • Advanced Communications • Electric Cars Sensors, data collection and Automation: Predictive and “Self Healing” Transmission Data Collection and Automation Transmission Power Stations Customer Distribution Using information, communications and control technologies to integrate the electricity network with “distributed energy” resources. Figure Source: Southern California Edison & CPUC
Intelligent Grid Research Program • 3-Year Collaborative Research (July 2008- June 2011) • Engagement with industry, regulators, policy makers, etc. Aim: to facilitate major greenhouse gas emission reductions by integrating distributed energy technology with a more intelligent electricity network. CSIRO 2: Market & Economic Modelling 3: Optimal Siting & Dispatch of DG 5: I Grid Social Impacts 6: I Grid in New Housing Development 7: Operational Control & Energy Management 1: Control Methodology of DG 4: Instit Barriers, Stakeholder Engagement & Economic Modelling UniSA Uni of Qld Uni of Qld QUT UTS Curtin Uni QUT Institutional Barriers Engagement: Australian Distributed Energy Roadmap DANCE Model: Avoidable Network Costs Economic regulatory barriers & solutions D-CODE Model: Costs of Distributed Energy
Networks and Climate Change More Network Capacity Electricity Supply Interruptions More (fossil fuel) power generation More Storms, Heatwaves, etc More Greenhouse gas emissions More Climate Change
Networks and Climate Change “$50 billion of further investment in national and local energy grids is necessary to meet Australia’s carbon reduction goals. If this doesn’t occur, we all face an increased risk of being left to sweat out decades of long hot summers. We know it is going to get warmer and we have to prepare for that – this last week has been a warning to us all – we need to act today to climate change proof our networks and to be climate change ready.” -Andrew Blyth, CEO Energy Networks Association, 2 February 2009, Canberra http://www.ena.asn.au/udocs/ena_020309_100854.pdf
Greenhouse Abatement Opportunities - USA “United States could reduce emissions by 31% to 46% by 2030”
D-CODE: Details and Cost of Distributed Energy NSW Case Study:Meeting NSW Electricity Needs to 2020 with lower costs and lower emissions
Scenarios for meeting the NSW power needs to 2020 Scenario 1 – COAL (approximates Owen Inquiry outcome) • 1000 MW coal power station 2017 • two 500 MW open cycle gas turbines in 2018 & 2019 Scenario 2 – GAS (~NEMMCO projections) • combination of open cycle and combined cycle gas Scenario 3 - Cogeneration and Demand Side Response Scenario 4 - Energy efficiency and Demand Side Response Scenario 5 - Combined distributed energy • energy efficiency, cogeneration, and demand side response, and • Allows 1000 MW coal fired capacity retirement in 2014/15.
Demand side response Cogeneration Energy efficiency NSW capacity projections to 2020 with DE 20,000 19,000 18,000 17,000 CAPACITY (MW) 16,000 15,000 14,000 13,000 12,000 2011/12 2012/13 2013/14 2014/15 2015/16 2019/20 2008/09 2009/10 2010/11 2016/17 2017/18 2018/19 Exisiting or planned capacity Capacity needed for reliability
90 87.6 86.4 85.4 85 84.7 Mt CO2-e per year 80 79.2 75 Network capital - amortized cost New supply - amortized capital cost New supply - variable cost Million Tonnes CO2-e in 2020 Scenario cumulative costs & 2020 emissions $35 $33 $31 $29 $27 70 Billion $ 2009 – 2020 $25 65 $23 60 $21 55 $19 50 $17 45 $15 40 Coal Gas Cogen and DSR Energy Combined efficiency and distributed DSR energy Existing supply - variable cost
Energy efficiency, cogeneration, and Demand Side Response can meet capacity shortfall • Not acting on DE will mean higher: • energy consumption, greenhouse emissions, network costs, generation costs, carbon abatement cost and consumer power bills
Australian Energy Regulator’s Network Pricing Decision (2009-14) $16.9 billion in Network Capital Expenditure (2009-14) 80% increase on the previous five years $2,400 per person in NSW $9.3 million per day For Energy Australia customers Average network prices increase by 99% (nominal) up to 172% for domestic customers Average retail price to rise by ~40% (excl. CPRS cost) Little direct support for Distributed Energy
Distribution Network Capital Expenditure Can we afford a much bigger grid and much smarter grid at the same time?
Network Prices to Rise (by up to 172%) 1 (Real Retail Prices up: 51% for small consumers; 34% for large consumers) Energy Australia Indicative Network Charges [1]Energy Australia, Revised Regulatory Proposal and Interim Submission, January 2009, p. 190
Energy Consumption Forecast to fall (AER Determination, Fig. 6.2, p. 114)
Peak Demand Forecast to rise (2.7% per annum) AER Determination, Table 6.4
Australian Distributed Energy Roadmap Roadmap Elements Defining Distributed Energy Energy Efficiency, Load Mgt, Distributed Generation External Data External Process DE Technology Assessment: Costs, Scale, Limitations Institutional Barriers What obstructs cost-effective DE? Research and Development Potential (current and future) Status (current and progress) Centralised Generation Costs, Scale, Limitations (NEM) Policy Instruments Can institutional barriers be effectively overcome? Assumptions & Scenario Analysis Demand Forecasting Energy and Peak Load (NEMMCO) Avoidable Network Costs (time and place) Policy Drivers Why do stakeholders care about DE? Proposed Network Investment (time and place) (NSPs)
Network Capacity Required Sydney by 2012 Avail. Capacity >15MVA < -10MVA
Indicative Network Investment Deferral Value ($/MVA/yr) -Sydney to 2012
Australian Distributed Energy Roadmap Roadmap Elements Defining Distributed Energy Energy Efficiency, Load Mgt, Distributed Generation External Data External Process DE Technology Assessment: Costs, Scale, Limitations Institutional Barriers What obstructs cost-effective DE? Research and Development Potential (current and future) Status (current and progress) Centralised Generation Costs, Scale, Limitations (NEM) Policy Instruments Can institutional barriers be effectively overcome? Assumptions & Scenario Analysis Demand Forecasting Energy and Peak Load (NEMMCO) Optimisation & Outputs: Costs, Prices, Emissions Avoidable Network Costs (time and place) Policy Drivers Why do stakeholders care about DE? Recommendations Proposed Network Investment (time and place) (NSPs) Social Decision Making: Political process; Policy and Market Design Consumer Acceptance Will consumers accept DE?
Plug In What’s a Hybrid Electric Vehicle (HEV)? • Has both petrol engine and electric motor and battery • Still runs on petrol only, but up to 50% more efficient • Engine does not idle, recovers braking energy, smaller capacity engine, runs engine at more optimal speed • Reduces reliance on oil (and imports) What’s a Plug-in Hybrid Electric Vehicle (PHEV)? • Bigger Battery • Socket & Charger to charge off electricity grid • Reduce greenhouse emissions • (if renewable powered) • Reduces urban pollution • Much lower running costs • (but high battery costs)
Why PHEVs? Conventional vehicle • petrol fuel • ~20% efficient Hybrid Electric Vehicle (HEV) • ~40% efficient • Long range, quick refuel • petrol fuel Plug-in Hybrid Electric Vehicle (PHEV) • Electric & petrol fuel • ~60% efficient • Long range, quick refuel Biofuel vehicle • renewable fuel • Competing land use, • biodiversity, food security Electric vehicle (EV) • electric fuel, ~80% efficient • Limited range, Slow recharge More oil use c PeakOil Global Warming More greenhouse emissions
PHEV Greenhouse Gas EmissionsComparison of PHEV emissions charged from various power stations types (Year 2010, 19,300 km per year, 30km electric range) Conventional car Renewable electricity Coal fired electricity Source: EPRI http://www.epri-reports.org/PHEV-ExecSum-vol1.pdf
Fuel Cost Comparison (Conventional petrol car vs PHEV per day for typical 30km commute) Petrol ($1.40/l)
Fuel Cost Comparison (Conventional petrol car vs PHEV per day for typical 30km commute) Actual one-off battery cost Petrol ($1.40/l)
Fuel Cost Comparison (Conventional petrol car vs PHEV per day for typical 30km commute) Estimated battery cost at production line volumes Petrol ($1.40/l)
Impact of PHEVs on Average Residential Power Demand (Summer Peak- NSW) ~8 kWh per day = ~60 km in PHEV Air Cond. O/Peak Water heating
Impact of PHEVs on Average Residential Power Demand (Summer Peak- NSW) ~8 kWh per day = >60 km in PHEV PHEV charge -uncontrolled Air Cond. Water heating
Impact of PHEVs on Average Residential Power Demand (Summer Peak- NSW) ~8 kWh per day = ~60 km in PHEV Air Cond. PHEV charge -controlled Water heating
Impact of PHEVs on Average Residential Power Demand (Summer Peak- NSW) ~8 kWh per day of load removed Air Cond.
Average Residential Power Demand (Summer Peak- NSW) Vehicle to Grid load management (peak load reduced) Air Cond.
Solar? What does a Solar Feed in tariff look at from a Intelligent Grid perspective? • A Gross Tariff of at least 30cents/kWh fixed for the term of the tariff. • The term of the tariff should be at least 10 years from the date of installation. • If necessary, the term of the FiT should be reviewed, rather than the rate. • Eligibility should be open to all electricity consumers • Consumers receiving the FiT should be required to purchase power through a time of use tariff. • This time of use tariff should be based on “net metering”
What’s next • Australian Distributed Energy Roadmap • Forum 1: Brisbane April 09: Introduction • Forum 2: Melbourne 14 July: Costs of Distributed Energy • Forum 3: Sydney August 09: Avoidable Network Costs • NSW Case Study Report release soon
Conclusions • Smart Grids, Electric Cars and Solar PV are strongly complementary • We are unlikely to be able to afford a much bigger grid and a much smarter grid at the same time • We need to make investment in distributed energy as easy as investment in networks. www.igrid.net.au