Download
1 / 37
380 likes | 680 Views
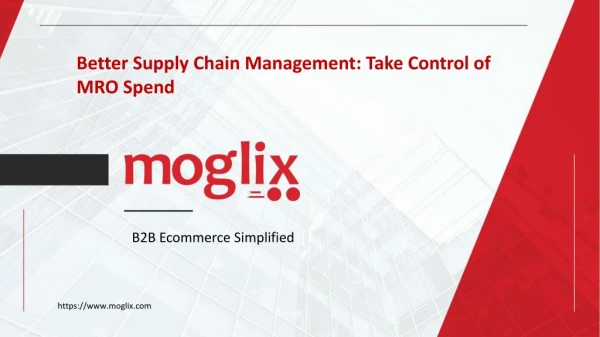
MRO Supply Chain Dynamics. John Henderson. MRO Supply Chain Dynamics. Changes in End-User Procurement Processes and Emerging Channels in Industrial Supply. OBJECTIVE

E N D
MRO Supply Chain Dynamics John Henderson
MRO Supply Chain Dynamics Changes in End-User ProcurementProcesses and Emerging Channelsin Industrial Supply • OBJECTIVE • Discuss end-user market dynamics that are impacting procurement processes. Review emerging supply channel models targeted at corporate procurement initiatives. Contact Information John Henderson President/CEOFrank Lynn & Associates, Inc.150 S. Wacker Drive, 17th FloorChicago, IL 60606312-558-4828jhenderson@franklynn.com
MRO Supply Chain Dynamics About Frank Lynn & Associates Frank Lynn & Associates (FL&A) is an international marketing consulting and research firm specializing in the development and implementation of sales and go-to-market strategies. For over thirty years, we’ve been pioneering ideas that help our clients optimize their market systems, obtain profitable growth, and drive shareholder value. • Founded in 1973, with more than 150 years of combined functional and industry expertise • Internationally recognized as the “channel experts” • Discussions in 2006 • 2,500 manufacturers and end-users • 800+ distributors, SI’s, Integrators
MRO Supply Chain Dynamics Our Industrial Clients REPRESENTING SOME OF THE BEST-MANAGED COMPANIES
MRO Supply Chain Dynamics Accelerating Change—The Headlines! • “Key Plant Closings Contribute to Further Declines in U.S. Manufacturing” • The Home Depot, Inc. Acquires Hughes Supply, Inc. • Globalization—“Is Wal-Mart Good for America?” • “Technical Support—Where Is It?”
MRO Supply Chain Dynamics Grainger Global Sourcing Grainger sources 5% of its products from outside the U.S.— mostly from Asia. • This trend is growing at 30% annually • Currently encompasses 5,600 products • includes—tools, material handling, motors and safety equipment • SOLO under private label • 24% of Grainger’s branch business sales are from private label products FL&A believes that large national distributors will grow the percentage of products supplied under private label—allowing them to function as the category manager.
MRO Supply Chain Dynamics Globalization How do large retailers impact industrial distribution and Motion Industries? • Push for low-cost goods leads to… • an increase in imports • an increase in contract manufacturing • a decrease in domestic manufacturing • Acquisition of new formats • Interest in MRO sales • creates an overlap in product categories and costs • Margin pressure for domestic manufacturers • creates additional pressure to reduce costs
MRO Supply Chain Dynamics Trends in Manufacturing U.S. manufacturers/customers are competing in an increasingly global marketplace and have been forced to redesign their fundamental business processes. • Lean Manufacturing • Low-Cost Country Sourcing • Six Sigma • Continuous Improvement • Total Quality Management (TQM) Cost Productivity
U.S. Manufacturing Industrial Production & Capacity U.S. Federal Reserve Capacity Production 2006 1988 MRO Supply Chain Dynamics Manufacturers Have Been Successful Although the number of personnel employed in manufacturing has decreased… U.S. industrial output has actually increased by ~15% since 2002 and by 25% over the past decade. 25% Production
MRO Supply Chain Dynamics What has Enabled Production Increases? Numerous internal and external changes have enabled manufacturers to substantially improve their productivity and lower their costs. CROSS—ORGANIZATIONAL PROCUREMENT SPECIFIC Business Process Outsourcing Value-Added Supply Chain Increased Productivity & Cost Reduction Process Control Leveraged Spending Inventory and Logistical Efficiencies “Best Practices” Benchmarking
MRO Supply Chain Dynamics Implications for Industrial MRO Spend Manufacturers have viewed more efficient management of plant MRO spend as being more difficult to implement and as having a lower return than other potential changes. Implementation Sequence Impact on Productivity • Capacity optimization (plant—personnel) • Production/product line focus/optimization • Process control/improvement • Inventory/logistics efficiencies • Consolidation of non-manufacturing functions • human resources, accounting, customer service • Standardized IT platforms across facilities • Leverage and efficiencies in direct spend categories • Standardizing processes across facilities • Managing indirect spend across facilities Difficulty of Implementation
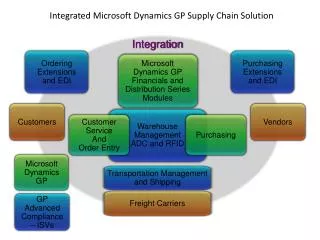
MRO Supply Chain Dynamics Process Changes Facilitate IndirectSpend Management Many of the initial process changes that manufacturers have undertaken provide the “tools” for corporate level purchasing to access and manage all spending at the plant level. • Standardization of IT platforms across all facilities • Consolidation of accounting and order processing functions • Establishment of Structures and Methodologies for benchmarking and transferring “best practices”
MRO Supply Chain Dynamics Changes in Industrial Supply Landscape Facilitate Indirect Spend Management Many of the developments in the traditional industrial supply market lower the complexity of managing high product diversity across geographies. • The emergence of “National” distributors • From 1997–2002, the number of “Industrial Distributors” declined 24% • 50 largest represent over 50% of total sales • Sophisticated, corporate-wide IT platforms at major distributors • Migration to increasingly broader product lines • Value-added distributor services and systems
MRO Supply Chain Dynamics New Procurement Models Have Emerged to More Efficiently Manage Indirect Spend Traditional Industrial Distribution Model MRO Products Manufacturer (MI Supplier) Distributor End-User
MRO Supply Chain Dynamics New Procurement Models Have Emerged to More Efficiently Manage Indirect Spend Focused on Lowering Costs Consolidated Procurement Models Newer Models Integrated Supply Model MRO Product Manufacturer MRO Product Manufacturer Purchasing Outsourcing Partner Purchasing Aggregator Distributor Distributor Integrated Supply Partner End-User End-User
Industrial procurement processes for indirect spend categories fall under one of three primary functional areas. MRO Supply Chain Dynamics Industrial Procurement Processes Total Industrial MRO Procurement Process Acquisition Management Processes Inventory/Logistics Management Processes Application/Utilization Management Processes • Product application mgmt • Standardization/optimization • Scrap reduction • Downtime reduction • Benchmarking • Environmental safety • Inventory mgmt • Logistics • In-plant logistics • Floor space planning • Usage reporting • MSDS & Hazmat mgmt • Sourcing • Management • Spend mgmt • Sourcing mgmt • Category mgmt • Transaction • Management • Technology • Process flow • Catalog content • Invoice mgmt • Accounts payable • Implementation
Integrated Supply was one of the earliest procurement models to address the need to manage MRO spend more efficiently. MRO Supply Chain Dynamics Integrated Supply Model Acquisition Management Processes Application/Utilization Management Processes • Inventory/Logistics Management Processes Transaction Management Sourcing Management Integrated Supply Providers Have internal transaction management systems. Often managed as “total spend.” Put personnel on plant floor to manage inventory and utilization processes. Typically manage most or all MRO spend.
MRO Supply Chain Dynamics Integrated Supply—U.S. Market Profile Percentage of Integrated Supply Market Spend U.S. ManufacturingFacilities 5% Largest Plants: ~1000+ Employees 70% 20% Medium-Sized Plants: ~300 to 1,000 Employees Small Plants: <300 Employees 75% 20% 10% Total of 344,188 Facilities Total Spend ~$15 Billion • Sources: Integrated Supply 3.5, 2002; Industrial Distribution, From Supplier to Service Provider, 10-1-2004; FL&A Analysis; US Census Data
Year 2 Year 3 Year 1 MRO Supply Chain Dynamics Integrated Supply Value Proposition Integrated Supply providers have historically offered a value proposition that includes savings through all three primary functional areas of procurement.
MRO Supply Chain Dynamics Integrated Supply Challenges • Limited to plants with large MRO spends—The level of MRO spend necessary to support in-plant personnel for Inventory/Logistics Management and Product Application Management limits the applications to large plants. • Process improvement savings require manufacturer/distributor participation— Delivering savings through Product Application Management requires access to high levels of product and application knowledge • How can an integrated supply provider secure necessary product support and access to new products through manufacturers while maintaining brand neutrality? • How can resistance to the adoption of new usage and application procedures be overcome? • Large end-user scope requires significant resources—Providing consistent support over a national or international footprint requires large internal resources. These challenges are exclusively in the Inventory and Application Management Functions
Newer models have emerged that offer end-users alternatives to internal management or Integrated Supply. MRO Supply Chain Dynamics Newer Procurement Models Acquisition Management Processes Inventory/Logistics Management Processes Application/Utilization Management Processes Sourcing Management Transaction Management “Aggregators” Ariba Infor/Datastream Osiris Product Category Partners “Procurement Outsourcers” AT Kearney ICG IBM Accenture DSSI CAP/Gemini Prosero
MRO Supply Chain Dynamics Purchasing Aggregators—Key Characteristics Focused on transactional efficiency and spend management tools. • What do they offer? • Electronic catalog and procurement software • How does end-user benefit? • Standardized, automated, paper-less procurement transactions • Reduction in plant level resources required to procure products • Better visibility to spend across multiple facilities • platform for reducing vendor base • platform for transference of “best practices” across facilities
MRO Supply Chain Dynamics Purchasing Aggregators—Key Characteristics Focused on transactional efficiency and spend management tools. • Inventory and Application Management Capabilities—None • Brand Preference—Neutral • Supplier needs to have appropriate electronic transaction capabilities • Business Models • Transaction fees, Gain share models • Migrating to management fees
MRO Supply Chain Dynamics Procurement Outsourcing—Key Characteristics Focused on transactional efficiency, vendor selection and leveraged spend across multiple clients. - What do they offer? • Electronic catalog, procurement software, and key procurement experts • How do end-users benefit? • Standardized, automated, paper-less procurement transactions • Reduction in plant level and corporate level resources required to procure products • Key product category relationships leveraged from other clients • low-cost / unit pricing leveraged across all clients • higher levels of service & support based on “key partner” relationships
MRO Supply Chain Dynamics Procurement Outsourcing—Key Characteristics Focused on transactional efficiency, vendor selection and leveraged spend across multiple clients. • Inventory and Application Management Capabilities • Leverage “key partners” capabilities • Brand Preference: “Key category partners” • Develop partners in key product categories that can provide appropriate product cross-references, low-cost/unit pricing and product application support • Business Models • Transaction fees, Gain share models, Management fees
MRO Supply Chain Dynamics New Procurement Models areHighly Visible Procurement Aggregators and Procurement Outsourcing Partners have established relationships with major end-users. MRO industrial product suppliers have increasingly encountered these programs and have had to evaluate their channel activities with respect to them. • Over 65% of these suppliers (> $10M in sales) have encountered these supply models • Over 10% of these suppliers characterize these models as either “mainstream” or “mature” processes
MRO Supply Chain Dynamics Procurement Model Differences Consolidated Procurement Programs Aggregators/ Purchasing Outsourcers Integrated Supply Programs Industry Program Size Brand Impact MRO Industrial Product Supplier Influence
MRO Supply Chain Dynamics Consolidated Buying Programs—Supplier’s View Sales through these programs are growing… • A targeted sales channel for over 80% of suppliers • 78% believe that these programs will continue to expand • 58% believe that these programs are a better growth opportunity than their conventional channels
MRO Supply Chain Dynamics Consolidated Buying Programs—Suppliers View The programs are less effective in developing profitable business… • Over 50% of suppliers have augmented their sales and technical service resources to increase their ability to address logistics and application management issues through these programs • 50% believe that consolidated buying programs are less effective than conventional channels
MRO Supply Chain Dynamics Transactional Efficiency and Spend Management/Reporting Systems—End Users’ View • 77% of end-user programs incorporated electronic ordering/catalogs • 64% utilized EDI billing • 29% utilized Procurement Cards (P-cards) to manage spend; an additional 21% had some other spend control in place. • 76% received summary billing • 73% had some level of consigned inventory Source: FL&A Research The findings all support the idea that these programs are directed at transactional efficiencies and spend management.
MRO Supply Chain Dynamics MRO Product Categories Affected Low Office Supplies Moderate Safety Equipment High Welding Supplies/ Compressed Gas Janitorial Supplies Fasteners PVF Electrical Hand/Power Tools Impact on Mfg. Level of Service HVAC Power Transmission Moderate Low Fluid Power/Hydraulics Chemicals/Lubricants Tooling Capitol Equipment High Volume of Spend Variability of Spend Low High
MRO Supply Chain Dynamics Impact on MRO Product Types Products with high levels of differentiation are the least likely to be sold through consolidated procurement programs. • Work Tables (Example) • Custom, power assist, automatically adjustable height work table that improves productivity and limits workman’s comp. claims • Standard size & height steel work table • Specialty Products • Unique value proposition • Variable or Low Spend • Limited supplier base High Level of Differentiation • Commodity Products • High, repetitive spend • Broad supplier base • Non-differentiated brands Low
MRO Supply Chain Dynamics Procurement Models Impact onMotion Industries Total U.S. MRO Market $465B The vast majority of industrial MRO sales will go through traditional distribution channels. Within this landscape, Motion’s value proposition of scale, service and product scope will provide competitive advantages. Approximately 50 players in this market space. Industrial MRO $187B 41% Non-Industrial MRO $278B 59% Industrial MRO Market $187B Direct, Retail & OEM MRO sales $56B 30% Industrial MRO Through Traditional Distribution Channels $113B 59% 11% MRO sales Through New Structures $18B Note: Estimates of the size of the U.S. industrial MRO market vary from $120B to $225B depending on the scope.
MRO Supply Chain Dynamics Aggregators and Procurement Outsourcersare Not Providing Logistics andApplication Management Inventory/Logistics Management Processes Acquisition Management Processes Application/Utilization Management Processes “Aggregators” Distributor With increased spend visibility – will migrate to larger receptive national partners “Procurement Outsourcers” Product Category Partners National partners with broad-line capabilities who can deliver inventory/logistics and application management
MRO Supply Chain Dynamics Plant-Level Changes Inventory/Logistics Management Processes Acquisition Management Processes Application/Utilization Management Processes • Reduced Plant-Level Purchase Contacts • Make products accessible • Standardized pricing • Increased Reliance on Vendors for Inventory and Logistics • Fewer on-site resources for managing expediting orders • Increased Interaction with End-User Plant and Engineering Resources • Cross-references • “Best Practices” Overall, changes should result in access to more spend for partners like Motion Industries within plants and across organizations.
End users believe that they now have tools to manage transactional efficiencies and are increasingly looking at multiple “Key Partner” relationships to drive application/utilization efficiencies. Motion is well-positioned to deliver this value across power transmission and motion control applications. MRO Supply Chain Dynamics Delivering Long-Term Cost Savings Application/Utilization Management Processes Power Transmission Specialist Tooling Specialist Office Supplies Specialist Compressed Gas Specialist Chemicals Specialist Inventory/ Logistics Management Processes Aggregators, Procurement Outsourcers or Internal Systems Acquisition Management Processes Long-Term Cost Reduction
MRO Supply Chain Dynamics Emerging Procurement Models (Aggregator/Procurement Outsourcing)Summary • Can be used in a wider range of industries and plant sizes • Are able to capture a wider range of MRO spend via transaction management • Have a higher use of suppliers with: - IT Platform to support transaction management - Product application knowledge - Logistical management capabilities • Result in more influence for supplier and/or channel • Location of influence depends on whether channel or manufacturer supply technical support and process improvements