Download
1 / 31
500 likes | 1.6k Views
Toxicology. An introduction for chemical engineers. Toxicology. Definitions Toxicological studies Dose-response correlations Threshold limit values Examples. Environmental Health Paradigm. Exposure Assessment Emission Sources Environmental Concentrations

E N D
Toxicology An introduction for chemical engineers
Toxicology • Definitions • Toxicological studies • Dose-response correlations • Threshold limit values • Examples
Environmental Health Paradigm Exposure Assessment Emission Sources Environmental Concentrations Effects Assessment Internal Dose Human Exposure Health Effects
Hazardous • Denotes the probability of injury or illness from contact or use • Industrial Hazards • Toxicity • Explosivity • Ignitability • Reactivity
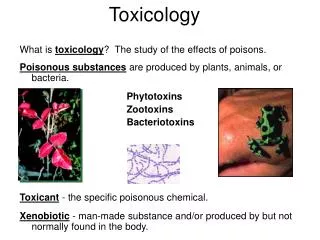
Toxic Substance • Capacity of a substance to produce injury or illness • Acute Effects • Short term, appear shortly after exposure. Can be from single exposure • Chronic Effects • There is a latency, long period of time before you see effect
Three Types of Toxic Hazardous Materials • Chemical Agents (poisons) • Physical Agents (dusts, fibers, heat, noise, corrosive) • Biological Agents (pathogens)
Definitions • Toxicology is the quantitative and qualitative study of the adverse effects of toxicants on biological organisms • Toxicant is a chemical or physical agent that produces adverse effects on biological organisms.
So Toxicology is the study of: • How toxicants enter the organism • How toxicants effect the organism • How toxicants are eliminated from (leave) the organism All substances are toxic if taken in the wrong quantities
How toxicants enter organism • Inhalation (mouth or nose to lungs) then into blood(+*) • Ingestion (mouth to stomach) then into blood(+) • Injection (cuts, punctures in skin) into blood • Dermal absorption (through skin) into blood(+*) + Involve membrane transport * Greatest threats in industry
Effects of Toxicants Irreversible Effects • Carcinogen - causes cancer • Mutagen - causes chromosome damage • Reproductive hazard - damage to reproductive system • Teratogen - causes birth defects
Effects of Toxicants May or may not be reversible • Dermatotoxic – affects skin • Hemotoxic – affects blood • Hepatotoxic – affects liver • Nephrotoxic – affects kidneys • Neurotoxic – affects nervous system • Pulmonotoxic – affects lungs
Definitions • Pharmacokinetics – the absorption, distribution, metabolism and excretion of chemicals through the (human) system. • Bioaccumulation – things such as lead, mercury, PCBs, carbon tetrachloride that build up in organs and have low excretion rate. Low exposure over a long time leads to response
Elimination of toxins • Excretion through kidneys, liver and lungs • Detoxification is the biotransformation of chemicals into something less harmful • Storage in fatty tissue
Toxicological Studies • Baseline study with no toxicant • Toxicology study to quantify response to toxicants in specified physical state
Difficulties in Toxicological studies • Baseline study required (control group) • Response not necessarily numerical • Specificity of individual response • Allergy or immunity • Statistical study required • Organism specific response, not applicable to humans • Dosage response • Response time, latency, acute versus chronic • Difficulty in measuring intended variable (lead in liver measured by lead in blood)
Difficulties in Toxicological Studies • Major Problem • No ethical way to get human volunteers, hence need to use “model” systems of rats, cats, dogs, rabbits, etc. • Hinders production of a new chemical, almost as stringent as a new drug • Currently averages 17 years and 1 million pages
Dose versus Response • Run test on “large” population • Given same dose (usually in dose/body mass) • Determine the number or fraction of individuals that have a response
Dose versus Response (cont) • Repeat tests using different doses • Find average response to each dose • Plot Response versus logarithm of dose • Forms Sigmoid shaped curve
Dose Limit Values • EDf– Effective dose for f percent of population. Reversible response • TDf – Toxic dose for f percent of population. Undesirable response that is irreversible • LDf – Lethal dose for f percent of population.
Definitions • Therapeutic Margin • TM = LD50% - ED50% • Margin of Safety • MOS = LD5% - ED95% • Safety Index • SI = LD5%/ED95% • Therapeutic Index • TI = LD50%/ED50%
Relative Toxicity Classification ClassificationHuman Oral LD50 Extremely Toxic Taste (1 grain) Highly Toxic 1 tsp Moderately Toxic 1 oz Slightly Toxic 1 pt Practically nontoxic 1 qt Relatively harmless > 1 qt
Dose/Response Models • Use Probits to Linearize Dose-Response Curve • P(Y) = ½[erf(Y-5/2) + 1] • Use Table 2.4 • Some calculators calculate the erfc (complimentary error function) erfc = 1 – erf(x)
Probit Correlations • Table 2-5 gives values of a linear interpolation of Dose/Response data that has been linearized using Probits. • Y = k1 + k2*Ln(V) Y – Probit V – Causative variable
Chemical Vapors • When dealing with exposures of a chemical vapor (toxic cloud) then the probit constants are correlated by: • Y = a + b ln Cnt • a, b and n are experimentally determined constants • C is concentration in ppm • t is the exposure time in minutes
Chemical Vapors • When the exposed subjects receive different doses as a function of time Received handout with constants, ought to place in your book
Threshold Limit Values • Lowest value on the response versus dose curve is called the threshold dose. • American Conference of Governmental Industrial Hygienists (ACGIH) has established “Threshold Limit Values” (TLV) • United States Occupational Safety and Health Administration (OSHA) has established “Permissible Exposure Limits” (PEL) • Table 2-8 gives the TLVs and PELs for many substances
Threshold Limit Values • TLVTWA Time weighted average for a normal 8 hour workday or 40 hour workweek • TLVSTEL Short-term exposure limit. The maximum concentration can be exposed to for up to 15 minutes. Four excursions per day with at least 60 minutes between • TLVC Ceiling limit. This concentration should not be exceeded
Converting from mg/m3 to ppm • M is molecular weight • T is temperature in Kelvin • P is pressure in atm