Download

1 / 10
100 likes | 218 Views
A psychophysical analysis of the base rate fallacy. The base rate frequency bias. The mammography problem The probability of breast cancer is 1% for a woman at age forty who participates in routine screening.

E N D
The base rate frequency bias The mammography problem The probability of breast cancer is 1% for a woman at age forty who participates in routine screening. If a woman has breast cancer, the probability is 80% that she will get a positive mammography. If a woman does not have breast cancer, the probability is 9.6% that she will also get a positive mammography. A woman in this age group had a positive mammography in a routine screening. What is the probability that she actually has breast cancer? (Gigerenzer and Hoffrage, 1995) The information we have • The “a priori” probability of a breast cancer: P(B.C.) • The conditional probabilities to be positive with and without B.C.: P(Pos|B.C.) , P(Pos|¬B.C.) The correct solution of the problem The most frequent subjective estimations The 95% of the subjects give an estimation of the probability for the woman to have a breast cancer between 70% and 80% (Eddy, 1982)
The dual process hypothesis • Strategic processing • Mental representations • Examples of theories: • Human problem solving (Newell & Simon, 1972) • Mental models (Johnson-Laird, 1989) • Features: • Effortful processing • Goal-directed • Automatic processing • Features: • No attentional control required • Obliged course • Stimulus dependent • Examples of phenomena • Conditioned reflexes • Implicit memory
There is a pack of cards, every card has a symbol on a side and a colour on the other side. The symbol could be an O or an X. The colour could be Red or Blue. The probability that a card has an O on one of its side is 5%. If a card has an O on a side the probability is 80% that it is Red on the other side. If a card has an X on a side the probability is 20% that it is Red on the other side. A card from the pack is Red. Which is the probability it has an O on the other side? The outcomes:O or X The data:Red or Blue The information we have:P( O), P( Red| O), P( Red| X) The information we want: P( O| Red) The solution: A bayesian game with cards
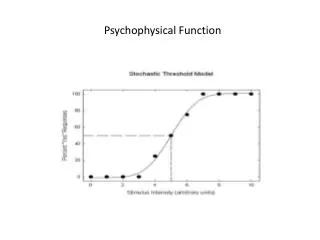
The design of the experiment The independent variables • The type of presentation of the information: dynamic or static, varying through the treatments • The real probability of the outcome given by the Bayes theorem and varying from trial to trial • The difficulty: the incidence of the a priori probability on the real probability, varying through the trials with the same real probability The dependent variable • The subjective probability: the choice for an outcome and the amount of money of the bet The hypothesis • In the second treatment the subjective probability fits with the real probability better than in the first treatment The goodness of fit measure: • The d’ : the difference between the z points of the proportions of choices for the outcome when its probability is higher and lower than 50%
The subjective probability • The external validity problem • Should we trust the statements of the subjects? • Do the subjects understand the numbers? • The subjective probability • The probability is the relative willingness to invest in the occurrence of a future event (De Finetti, 1931) Choice: ¬A A Certainty Uncertainty Certainty 0 10% 30% 50% 70% 90% 100% 2€ 1€ 50c 20c 20c 50c 1€ 2€
The meaning of the d’ Wrong bets for O Wrong bets for X Correct bets for O Correct bets for X 0 10% 30% 50% 70% 90% 100% d’
Results of a pilot experiment In all the trials In the difficult trials
Considering the money Dynamic Game Static Game 3,5£ 3,5£ 3£ 2,5£ 3£ 2,5£ 2£ 2£
Conclusions • The base rate fallacy in these games is not so pervasive as in the written problems • It seems to depend more by the amount of ambiguity of the information than by the kind of cognitive process the subjects use • There is a clear correlation between the amount of money the subjects invest and their ability to guess the most probable outcome