Download
1 / 18
180 likes | 301 Views
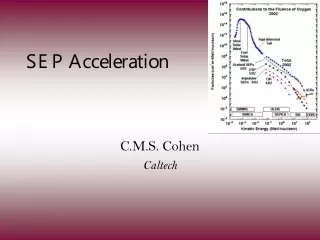
Progress Toward Measurements of Suprathermal Proton Seed Particle Populations J. Raymond, J. Kohl, A. Panasyuk, L. Gardner, and S. Cranmer Harvard-Smithsonian Center for Astrophysics. SEP Source Regions.

E N D
Progress Toward Measurements of Suprathermal Proton Seed Particle PopulationsJ. Raymond, J. Kohl, A. Panasyuk, L. Gardner,and S. CranmerHarvard-Smithsonian Center for Astrophysics
SEP Source Regions • The source regions of solar energetic particles (SEPs) are not well established and the physical processes associated with their acceleration are not well understood. • Gradual phase SEPs are believed to be produced by CME shocks, while impulsive phase SEPs are believed to be produced in the current sheet or other sites closely associated with the solar flare.
M. A. Lee (1983, 2005) developed a theory of coupled turbulent wave excitation and proton acceleration at shocks. Theory of shock acceleration of SEPs
In this theory, in order to produce large SEP events, it is necessary for a suprathermal seed particle population to exist with 0.001 to 0.01 of the proton velocity distribution having an injection speed higher than 2 times the difference between the shock speed and the wave phase speed (~VA in corona). Gopalswamy et al. (2004) found higher SEP intensities when there was a preceding CME within ~24 hours that perhaps left behind suprathermals. Theory of shock acceleration of SEPs
Density of Suprathermal Seed Particles Preshock • fi (v): Resonantly scattered Ly constrains the seed particle distribution • fe(v): Thomson-scattered Ly
Kappa needed to provide population fractions with velocities above the injection velocity • Estimated required injection speeds of 940 – 1460 km/s, are 6.1 to 9.7 in units of V1/e • An isotropic kappa distribution where .01 - .001 of the population has speeds beyond 6.1 to 9.7 V1/e has a kappa = 2 - 4. • Hence, proton velocity distributions with kappa values in this range and lower are of interest. Isotropic Case
Kappa needed to provide population fractions with velocities above the injection velocity Anisotropic Case • Plot is for case where perpendicular velocities are the same kappa distributions and parallel velocities are Maxwellian. • A kappa distribution where .01 - .001 of the population has speeds beyond 6.1 to 9.7 V1/e has a kappa between about 3.5 and 1.8. • Hence, measured profiles with kappa between 3.5 and 1.8 and lower are of interest.
UVCS Ly-α Channel Instrument Profile Left: UVCS instrument profile. Right: High spectral resolution scan of Ne-Pt hollow cathode spectrum convolved with UVCS instrument profile (black) and UVCS scan of lamp spectrum (red).
Simulation includes coronal emission assuming kappa = 4, Poisson noise, Binning to UVCS sampling, Random flat field uncertainty, Detector background, Fitting with and without error in instrument profile Fit with no profile error yields kappa = 3.92 +/- 0.66 Fit with profile error yields kappa = 3.66 +/- 0.59 Simulation of observation for kappa = 4
Can bulk outflow velocity be responsible for the observed departures from a Gaussian • The plot provides normalized intensity versus scaled wavelength for an assumed 2.0 MK proton temperature, the indicated wind speed at 1.7 RSun and the coronal hole geometry of Banaszkiewicz. • It can be seen that a flow velocity of > 450 km/s at 1.7 RSun would be needed to produce significant departures from a Gaussian shape. • We conclude that the observed proton velocity distributions are not influenced significantly by bulk outflow speed.
Straylight level is negligible except at several narrow wavelength bands
Observation of a proton velocity distribution with kappa = 3.5
Alternate OVI Redundant Channel and Ly-α Channel proton velocity measurements. • Fraction of protons with velocity > 6 V1/e for alternate observations with the two channels. • An isotropic velocity distribution is assumed for the purpose of calculating the fraction • Reasonably good agreement is found for the two channels
Streamer H I Lyα profiles at 1.8 & 2.2 R (May 2006) and 1.9 & 3.1 R (July 2006) Slit position for May 2006 Slit positions for July 2006
CME-Driven Shock Waves and SEPs • UV spectroscopic diagnostics can determine the parameters describing the shock itself and the pre- and post-shock plasma. • These parameters are needed as inputs to SEP acceleration models for specific events. • Required parameters: • Pre-CME density, temperatures, composition • Post-shock ion temperatures, which probe collisionless heating • Shock onset radius • Shock speed (≠ CME speed) • Shock compression ratio & Mach number • Magnetic field strength at onset radius
CME Shock Diagnostics • Pre-CME density, temperatures, composition: UVCS has measured these prior to 4 observed shocks. • Post-shock ion temperatures: UVCS has measured high temperatures of shock-heated plasma (Tp≠Tion) • Shock onset radius: The high temperatures (at specific radii) from UVCS indicate the shock has formed; Type II radio bursts give the density at which the shock forms. • Shock speed: UVCS density measurements allow the Type II density vs. time to be converted to shock speed (Vshock > VCME) • Shock compression ratio & Mach number: UVCS can measure the density ratio and the adiabatic proton temperature ratio (Lya), from which the Mach # can be derived. • Magnetic field strength at onset radius: At the onset radius, Mach # = 1, so measurement of Vshock gives VAlfven, and thus B.