Download
1 / 11
110 likes | 226 Views
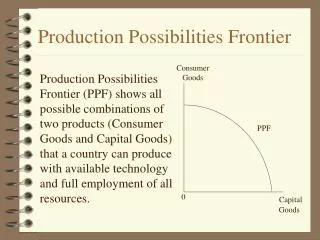
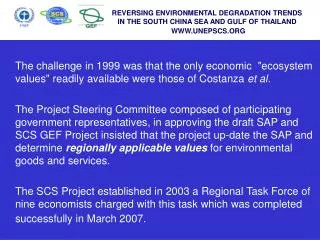
REVERSING ENVIRONMENTAL DEGRADATION TRENDS IN THE SOUTH CHINA SEA AND GULF OF THAILAND WWW.UNEPSCS.ORG. The challenge in 1999 was that the only economic "ecosystem values" readily available were those of Costanza et al.

E N D
REVERSING ENVIRONMENTAL DEGRADATION TRENDS IN THE SOUTH CHINA SEA AND GULF OF THAILANDWWW.UNEPSCS.ORG The challenge in 1999 was that the only economic "ecosystem values" readily available were those of Costanza et al. The Project Steering Committee composed of participating government representatives, in approving the draft SAP and SCS GEF Project insisted that the project up-date the SAP and determine regionally applicable values for environmental goods and services. The SCS Project established in 2003 a Regional Task Force of nine economists charged with this task which was completed successfully in March 2007.
REVERSING ENVIRONMENTAL DEGRADATION TRENDS IN THE SOUTH CHINA SEA AND GULF OF THAILANDWWW.UNEPSCS.ORG 1. Identifying the goods and ‘services’ - biologists, fisheries scientists, foresters 2. Assemble and evaluate empirical data for economic values of goods and ‘services’ - economists 3. Standardise the data from seven countries: Across years – Consumer Price Index Across Currencies – US dollar Output: Annual production and ‘service’ values in US dollars, per hectare,per annum
REVERSING ENVIRONMENTAL DEGRADATION TRENDS IN THE SOUTH CHINA SEA AND GULF OF THAILANDWWW.UNEPSCS.ORG Problem: ‘Farm gate’ prices for environmental goods vary within countries reflecting both the local supply and the demand Solution: Weight individual values according to the stock or area Weighted Mean National Value The summation of each price (value) multiplied by the stock to which it relates; divided by the total stock for which prices were available in the country
REVERSING ENVIRONMENTAL DEGRADATION TRENDS IN THE SOUTH CHINA SEA AND GULF OF THAILANDWWW.UNEPSCS.ORG WEIGHTED MEAN REGIONAL VALUE RvA1Kg = [(SCa*MVCa)+(SChi*MVChi)+(SIn*MVIn)+(SMa*MVMa)+ (SPh*MVPh)+(STh*MVTh)+(SVi*MVVi)] (SCa + SChi + SIn + SMa + SPh + STh + SVi) SCa = Stock in Cambodia MVCa = Standard Mean Value in Cambodia
REVERSING ENVIRONMENTAL DEGRADATION TRENDS IN THE SOUTH CHINA SEA AND GULF OF THAILANDWWW.UNEPSCS.ORG Tabulate Weighted National & Regional Mean ValuesDIRECT USES Mangrove Goods Cambodia China Indonesia ►7 countries Timber 779.95 137.07 73.55 Firewood 17.35 0.00 65.06 Poles 0.00 0.00 0.00 Charcoal 71.39 0.00 15.85 Leaves/palm fronds(Thatch, fodder) 13.66 0.00 0.00 Fruit/propagules 0.00 100.78 0.00 ►24 goods Weighted National Mean Value ∑Ca ∑Chi ∑In
REVERSING ENVIRONMENTAL DEGRADATION TRENDS IN THE SOUTH CHINA SEA AND GULF OF THAILANDWWW.UNEPSCS.ORG Tabulate Weighted National & Regional Mean ValuesSERVICES – INDIRECT AND NON-USE VALUES Mangrove Services Cambodia China Indonesia ►7 countries Ecotourism 0.00 0.00 59.79 Nursery Function 0.00 1,274.00 782.00 Coastal Protection 0.00 1,044.00 421.56 Aesthetic Value 0.00 1,867.00 0.00 ►9 “services” Weighted National Mean Value ∑Ca ∑Chi ∑In
REVERSING ENVIRONMENTAL DEGRADATION TRENDS IN THE SOUTH CHINA SEA AND GULF OF THAILANDWWW.UNEPSCS.ORG Total Economic Value of the habitats bordering the South China Sea is the summation of the regionally weighted values of the annual production of goods and ‘services’ per hectare. Total Economic Value for the entire area of each habitat is the product of this value multiplied by the total area of the habitat bordering the South China Sea.
REVERSING ENVIRONMENTAL DEGRADATION TRENDS IN THE SOUTH CHINA SEA AND GULF OF THAILANDWWW.UNEPSCS.ORG VALUE OF ANNUAL PRODUCTION IN THE SOUTH CHINA SEA Area ha US$/ha Total US$ Mangroves1,799,136 2,872 5,167,568,376 Coral reefs750,307 1,542 1,157,393,566 Seagrass 73,769 1,181 87,164,713
REVERSING ENVIRONMENTAL DEGRADATION TRENDS IN THE SOUTH CHINA SEA AND GULF OF THAILANDWWW.UNEPSCS.ORG • Regional Working Groups Identified regional level actions to ensure co-ordination of national level actions in the implementation of the Strategic Action Programme. Estimated the costs based upon experiences with the implementation of the SCS Project COSTS DO NOT INCLUDE the costs of actions in the National Action Plans that contribute towards the achievement of the regional targets of the Strategic Action Programme (SAP). If the environmental targets of the SAP are met then various economic benefits might be gained in terms of the avoidance of economic losses consequent upon the loss and degradation of coastal habitats.
REVERSING ENVIRONMENTAL DEGRADATION TRENDS IN THE SOUTH CHINA SEA AND GULF OF THAILANDWWW.UNEPSCS.ORG SAP COSTS COMPARED WITH VALUE OF ANNUAL PRODUCTION SAVED • Mangroves 2.99 million US dollars compared with 5.1 billion US dollars of annual production; • Coral reefs 3.96 million US dollars compared with 1.1 billion US dollars of annual production; • Seagrass 1.58 million US dollars compared with 87.2 million US dollars of annual production; • Wetlands 5.99 million US dollars compared with 1.2 billion dollars of annual production.
REVERSING ENVIRONMENTAL DEGRADATION TRENDS IN THE SOUTH CHINA SEA AND GULF OF THAILANDWWW.UNEPSCS.ORG COSTS AND BENEFITS OF MANGROVE INTERVENTIONS IN THE SAP [FIRST FIVE EYARS] • Costs 2007 values 2,994,073 • Benefits 2007 values 1,479,382,085 • Net Benefits 1,476,388,012