Download
1 / 12
120 likes | 189 Views
Explore the dynamics of global resources, focusing on water, energy, and nutrients. Understand the challenges and solutions for sustainable resource utilization. Learn about the importance of proper sanitation practices in resource management.

E N D
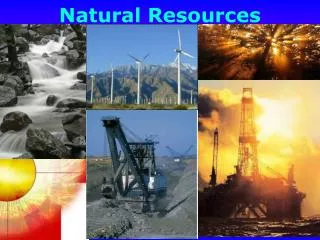
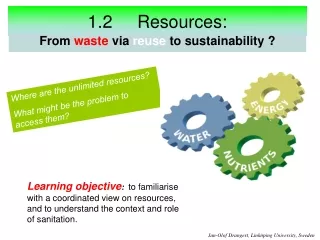
1.2 Resources: Where are the unlimited resources? What might be the problem to access them? energy From waste via reuse to sustainability ? Learning objective: to familiarise with a coordinated view on resources, and to understand the context and role of sanitation. Jan-Olof Drangert, Linköping University, Sweden
Water molecules cannot be manufactured or destroyed Water is renewable (sun-driven cycle) everywhere Water available in situ (rural, peri-urban) or imported (cities) Energy supplied by humans (rural) or electricity (urban) 70% of global water use is for crop production A balanced diet requires a loan of 1300m3/yr p person based on current practice. This is 70 times greater than the basic water need of 50 l per person per day. Phosphorus (P) cannot be manufactured or destroyed P is immobile and mined in only a few countries Food available in situ (rural) or mostly imported (cities) Energy supplied by humans and sun (rural) or fossil(urban) 90% of global rock P extrac-tion is for crop production A balanced diet results in depletion of 22.5 kg/yr of phosphate rock or 3.2 kg/yr of P per person based on current practices, of which 0.5 kg is found in the food. Reflections on water and plant nutrients Jan-Olof Drangert, Linköping University, Sweden
Input to and output from the food chain fertilizer rain & irrigation water manure choice loss excreta organics agri- culture households no choice evapo- transpi-ration food Losses on farm Jan-Olof Drangert, Linköping University, Sweden
The water cycle – dynamics does the trick Instant snap shot: Shortage of freshwater ! Clouds 0.001% 8 days A dynamic perspective gives a better description: ” but, H2O is always on the move ...” Renewable rain gives in 2000 yearsas much water as is in the oceans!!! Rivers 0.0002% 16 000 years Lakes 0.007% 280 days Oceans 96.5% Ice caps 2.7% 3 000 years Groundwater 0.7% 4 600 years Jan-Olof Drangert, Linköping University, Sweden
Annual renewal and use of fresh water Source: P. Gleick, 1993
Global scarcity of plant nutrients - a new driving factor for sanitation • Phosphorus is a limited resource, and large untapped reserves will eventually only be found on sea shelves and as anthropogenic depositions in lake sediments. • 95% of mined potash goes to the fertiliser industry and has no substitute. Mines exhausted in some 50 years. • 60% of mined sulphur goes to fertilizer industry and has no substitute. Mines exhausted in some 20 years. • Costly to recover these plant nutrients from lake sediments compared to trapping them directly at the source i.e.as output from households and industries. • Nitrogen can be manufactured from the N in the air, but this requires much energy (1 litre of oil to produce 1 kg of nitrogen). D. Cordell & J-O Drangert, Linköping University, Sweden
Phosphate Rock – Worldwide Estimates(thousands of metric tons) P scarcity is worse than oil scarcity because P CANNOT be substituted in food production Courtesy of Ian Caldwell, Stockholm Envrionment Institute, Sweden
Food, water and nutrient flows 0.9 l transpiration & evaporation H2O 1.5 l food 1.1 l Urine: 1.5 l Faeces: 0.15 l + nutrients Virtual water 4 cu.m. + nutrients Jan-Olof Drangert, Linköping University, Sweden
NUTRIENTS – and demography Billion people 9 World Total 16th - 21st century 6 21th century 20th century urban 3 rural 1500 1600 1700 1800 1900 2000 2100 Jan-Olof Drangert, Linköping University, Sweden
Actual reuse of nutrientsfor urban agriculture & food security(in Swedish towns 1850 – 2000) Proportion nutrients being reused 100% Glass, tins, ceramics Heavy metals 50% waste pits + urine diversion +WC stop only WC +WWTP 1870 1910 1950 2000 Jan-Olof Drangert, Linköping University, Sweden
Human resources: capacity to manage sanitation arrangements Level of management WWTP, biogas Utility sewerage flush toilet, water supply, Organic waste sewerage drainage wetland urine-diverting toilet septic tank Grease trap, Household Organic waste pit latrine biogas User contribution Work hours Paying fees Jan-Olof Drangert, Linköping University, Sweden
”Manpower blindness”: driver of new responsibility sharing • We tend to account only for what is done by governments and projects in water and sanitation • What is done by residents and small entrepreneursis rarely appreciated, if at all recognized (blindness) • Yet, many urbanites survive thanks to such local initiatives • Here, we pledge that both kinds of activities are needed to solve current sanitation problems Our pre-conceived views play a role Jan-Olof Drangert, Linköping University, Sweden