Download
1 / 41
430 likes | 651 Views
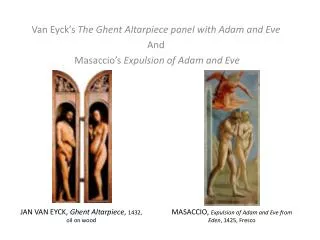
The future of regions in the perspective of global change. Warsaw, Bristol Hotel, 9 - 10 June 2008 . III. Greater Poland growth scenarios 2020 and 2050. Waldemar Ratajczak Adam Mickiewicz University Pozna Å„.

E N D
The future of regions in the perspective of global change Warsaw, Bristol Hotel,9 - 10June 2008. III Greater Poland growth scenarios 2020 and 2050 Waldemar Ratajczak Adam Mickiewicz University Poznań
GREATER POLANDis aREGION OF WELL-ESTABLISHED IDENTITY Maior Polonia ≡ the Oldest Poland ≡ Greater Poland
II. GREATER POLAND: PROFILE Greater Poland and the country • among the biggest and strongest voivodships, • a relatively good demographic situation –life expectancy (71.4 years) above the national average (70.9), • a strong academic centre in Poznań with a large number of students. 9.3% of the voivodship’s population has tertiary education (cf. The Voivodship’s Development Strategy p. 35), • A major communication route: east-west.
Table 1. GDP in Euros by purchasing power parity Source: Eurostat 2006.
Share in %: Figure 1. Share of new and upgraded goods production in the industry’s sold production in 2003 by voivodships Source: Chojnicki Z., Czyż T. 2006
Figure 2. Human potential:tertiary education Source: Chojnicki Z., Czyż T. 2006
Greater Poland and Europe • possible spill-over with the Berlin metropolis, • competes with similar status regions, e.g. the ‘Saxon Triangle’ Leipzig-Dresden-Chemnitz, • located on the Paris-Berlin-Warsaw-Moscow line • A laboratory of the cohesion policy in 2007-2013 (and the following?) – a region of a large convergence potential, • GDP (PPP) per capita in Greater Poland amounting to 55% of GDP per capita in 27 EU countries.
Figure 3. The RCI pilot – distribution of the regioncompetitiveness index Source: Own construction
Figure 4. The RESI pilot –distribution of sustainable environment use index Source: Own construction
II. THE FUTURE OF GREATER POLANDas aREGION OF EUROPE THERE IS NO SCIENCE WHICH WOULD MAKE A HUMAN BEING REALIZE HOW TO IMPLEMENT HIS INTENTIONS John Stuart Mill (1800-1873) therefore NOBODY KNOWS THE FUTURE – HENCE IT NEEDS TO BE INVENTED ATTALI 2002
SCIENTIFIC WAYS OF INVENTINGA REGION’S FUTURE Figure 5. Economic theories of regional growth Source: Own compilation
MASST Macroeconomic Sectoral, Social and Territorial Model Figure 6. Average population growth in 2003-2015 Source: Capello at al. 2008
MASST Macroeconomic Sectoral, Social and Territorial Model Figure 7. The role of agglomerations in regional growth Source: Capello et al. 2008
According to Florida’s creative class theory, Greater Poland is on its way to a social and economic progress by developing the three T’s: Technology, Talent and Tolerance (Trust). Poznań as a city is the core of its METROPOLITAN AREA which is considered as future europolis.
Figure 8.Employment in the creative knowledge sector in Poznań and its metropolitan area (2001-2005) Source: Stryjakiewicz et al. 2008
Degrees of genetic determinism in pathdependence Antonelli 1997: • A state at time t that is predictable at time t-1 is past dependent • A state at time 1 that is predictable from the sequence of prior states at time t-n is path dependent
Figure 9. Trajectory lifecycle Source: Davis C. 2004 ‘For unto every one that hath shall be given, and he shall have abundance: but from him that hath not shall be taken away even that which he hath.’ St. Mathew 25:29
Figure 10. The evolution process towards chaos Source:Poleszczuk J. 2004
Figure 11. The ‘new’ economy’s path towards an anthropogenetic regime Source: Boyer R. 2004
SELF – ORGANIZING INNOVATIVE COMPLEXES 3. Development through INNOVATION Figure 12. Creating a region of own innovative activity Source: Own construction
INNOVATION is about applying knowledge to create new knowledge. It requires: • a systematic approach, • an intellectual effort, • a high degree of organization, • decentralization, • diversity.
Figure 13. The Regional Innovation System (RIS) Source: Wolf D.A. 2002
Greater Poland region clusters- the automotive cluster(existing; commercial cars: MAN, VW, Solaris, Groclin)- the furniture cluster(originating; various types of production: VOX, numerous small and medium-sized companies from Swarzędz)- the chemical cluster(originating; various industries: Baiersdorf, Bridgestone-Stomil, GSK, Dramers, UNIA, ZCh Luboń)- the food-processing cluster (in transformation; chiefly the confectionery industry: Terravita, Jutrzenka, Millano, Kraft, Unilever, many other small and medium-sized companies) - the biotechnological cluster (prospective; a robust scientific basis yet the companies are scarce)- the bio fuel cluster (prospective, good prospects owing to well-developed various branches of agriculture).
Figure14. The synergy between the 7PR and CIP framework programmes and structural funds Source: Bąkowski A. at al. 2007
4. Greater Poland region development scenarios ABC – Scenarios 2007-2020 DEF – Scenarios 2020-2050 2006 – The diagnosis of 2006 2020 – The vision of 2020 and the ‘diagnosis’ of 2020 One – The diagnostic background for Scenario D – the field between Scenario A and B Two – The diagnostic background for Scenario E – the field between Scenario B and C Three – The diagnostic background for Scenario F – the field between Scenario C and A 2050 – The vision of 2050 Figure 15. The New Futurology Structure Source: Kukliński A. 2007
CONTEMPORARY MEGATRENDS IN GLOBAL AND EUROPEAN ECONOMIES • Business globalization • International integration • Sustainable development – eco-capitalism • Non-existent comparative advantage in economy • The New Lisbon Strategy • Growing population and mobility, society aging SELF-ORGANIZING economy Toffler A. 1998, Drucker P.F. 1999, Thurow L.C. 1996
THE NEW ECONOMY RULES (1) Embrace the Swarm. As power flows away from the center, the competitive advantage belongs to those who learn how to embrace decentralized points of control. (2) Increasing Returns. As the number of connections between people and things add up, the consequences of those connections multiply out even faster, so that initial successes aren’t self-limiting, but self-feeding. (3) Plentitude, Not Scarcity. As manufacturing techniques perfect the art of making copies plentiful, value is carried by abundance, rather than scarcity, inverting traditional business propositions. (4) Follow the Free. As resource scarcity gives way to abundance, generosity begets wealth. Following the free rehearses the inevitable fall of prices, and takes advantage of the only true scarcity: human attention. (5) Feed the Web First. As networks entangle all commerce, a firm’s primary focus shifts from maximizing the firm’s value to maximizing the network’s value. Unless the net survives, the firm perishes.
(6)Let Go at the Top. As innovation accelerates, abandoning the highly successful in order to escape from its eventual obsolescence becomes the most difficult and yet most essential task. (7) From Places to Spaces. As physical proximity (place) is replaced by multiple interactions with anything, anytime, anywhere (space), the opportunities for intermediaries, middlemen, and mid-size niches expand greatly. (8) No Harmony, All Flux. As turbulence and instability become the norm in business, the most effective survival stance is a constant but highly selective disruption that we call innovation. (9) Relationship Tech. As the soft trumps the hard, the most powerful technologies are those that enhance, amplify, extend, augment, distil, recall, expand, and develop soft relationships of all types. (10) Opportunities Before Efficiencies. As fortunes are made by training machines to be ever more efficient, there is yet far greater wealth to be had by unleashing the inefficient discovery and creation of new opportunities. Kelly K. 2001
Figure 16. Factors affecting regional welfare Source: Sherman H. 2007
Figure 17. The conceptual model of sustainable development Source: Owncompilation
2006 Diagnosis • Growing discrepancy between ”the core” and the rest of the region (cf: The Voivodship’s Development Strategy pp. 28-30), • Intensified migration from other regions and abroad, • Regional Operating Programmes: increasing the region’s real strength, • Social and spatial disproportions in access to IT and telecommunication services, • ‘Sub-urbanization instead of town-planning’ accompanied by diversification of the spatial development in a given region, • Thriving social self-organization and an individual participation crisis Source: Bejm et al. 2008
2020 Vision • Towards demographic and migration-related equilibrium, • Threat of uncontrolled urban sprawl, the challenge of metropolization and global city competition • Trend towards energetic diversification, green energy, • Combating ”digital exclusion” – unequal access to IT services, • Building a civil society – growth of the 3rd sector in the realm of social integration and cultural activity, • Transfer from development induced by structural funds to spontaneous development, Source: Bejm et al. 2008
2050Vision • ”Experience-based Business” (60+) as the region’s response to the advanced society aging process, • New relations in the EU – state – region triangle: verified federalist doctrine, • High compliance of the region’s real and institutional structures – the region’s boundaries in line with its actual reach, eliminating regional discrepancies. • Greater Poland region as a ”green energy” hub and a bio-technology centre, • Communication enhanced owing to ‘the Network of Networks’, • Cities – carriers of identity and culture in the worldwide net Source: Bejm et al. 2008
Example: Demography2006 Diagnosis • The demographic potential: the Greater Poland society is young (median age in 2006 – 35.4 years; national average - 37 years) and life expectancy is high (71.4 against 70.9) • Low demographic encumbrance (drop in 1996-2006), 65% of the population at professionally active age – a basis for economic growth, • migrations: a good national balance (in 2001-2006 0.7 per mille), since 2006 intensified emigration to West Europe, • Maintained positive birth rate although reproduction remains limited (total fertility rate of 1.37), • The situation is grave in the eastern part of the region (Kalisz, Konin): fewer individuals at professionally active age, lower birth rate, intense migration in 2006 Source: op. cit.
Example: Demography2020Vision THE OPTIMISTIC SCENARIO • A slow, regular growth in total fertility rate (1.7-1.8 in 2020) • Greater Poland remains an attractive destination of migration from other regions (balance: 0,5 per mil or more), a large part of the migration back THE REALISTIC SCENARIO • A small growth in TFR to 1.5 -1.6 child per woman • A marked influence of ‘the second demographic transfer’: households drop in size, especially in the cities, • An influx from other regions in the country (up to 0.5 per mil), possible slight increase in migration, the majority of emigrants stay abroad, THE PESYMISTIC SCENARIO • Still very limited reproduction (1.3-1.4 child per woman) • A stop to the influx from other regions and non-existent back migrations from Western Europe, • Deteriorating population situation, especially in the eastern part of the region Source: op. cit.
Example: Demography2050Vision THE OPTIMISTIC SCENARIO • ‘experience-based Business’ (60+): capitalizing on older employees’ experience, especially in higher rank services (an active aging strategy), • A limited impact of demographic encumbrance on the pension system owing to the family policy advocated in the former years (up to 2020), THE REALISTIC SCENARIO • partly capitalizing on experience (60+), chiefly in Poznań and its vicinity (active strategy), • possible generation clash: the generation entering the labour market, • in 2006 Greater Poland had 403 thou. people aged over 65 (most of them retired) and 589 thou. people aged 20-29. In 2050 most of them will be aged 64 to 73 and to a large extent will remain professionally active. THE PESIMISTIC SCENARIO • failure to capitalize on employees’ experience, a passive ageing strategy (mostly social benefits, healthcare), • an ineffective pension system. Source: op. cit.
Figure 18. Greater Poland’s development strategic tableau Source: Own compilation
Figure 19. Modern economy centres and areas Source: Own compilation
Greater Poland is not only a region where growth occurs but also an engine of growth itselfafter Nijkamp 2008