Download
1 / 1
10 likes | 113 Views
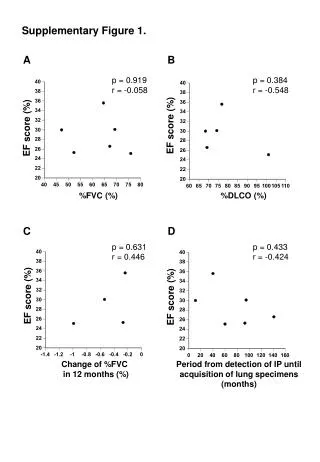
This study examines the correlation between EF score, %FVC, and %DLCO in interstitial pneumonia with a focus on changes over 12 months. The period from detection to lung specimen acquisition also impacts the analysis.

E N D
Supplementary Figure 1. A B p = 0.919 r = -0.058 p = 0.384 r = -0.548 EF score (%) EF score (%) %FVC (%) %DLCO (%) C D p = 0.631 r = 0.446 p = 0.433 r = -0.424 EF score (%) EF score (%) Change of %FVC in 12 months (%) Period from detection of IP untilacquisition oflung specimens (months)


