Tanker contracting bn $/ m dwt
220 likes | 390 Views
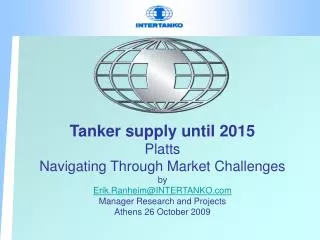
Tanker supply until 2015 Platts Navigating Through Market Challenges by Erik.Ranheim@INTERTANKO.com Manager Research and Projects Athens 26 October 2009. Tanker contracting bn $/ m dwt. bn $. m dwt. Av 7.2 17.5. 20.1 411.3 average yearly $ 38.4 62.9 average yearly dwt.

Tanker contracting bn $/ m dwt
E N D
Presentation Transcript
Tanker supply until 2015PlattsNavigating Through Market ChallengesbyErik.Ranheim@INTERTANKO.comManager Research and ProjectsAthens 26 October 2009
Tanker contracting bn $/ m dwt bn $ m dwt Av 7.2 17.5 20.1 411.3 average yearly $ 38.4 62.9 averageyearly dwt Source. Clarkson Shipyard Monitor
Tanker fleet, orderbook, SH tankers10,000 dwt + m dwt 50.2 121.8 403.4 m dwt A modern fleet:1 Oct 2009Average age 9.1 years 90% =<20 years old 79% =<15 years old 67% =<10 years old
Tanker deliveries, removals, max phase-out10,000 – 59,999 dwt m dwt 2009 2% reduction demand Fleet 1,617 60.3 m dwtOrderb. 312 13.5 “ 22% Not DH 356 11.2 ” 20% Assumed balanced market end 2008Deliveries and orderbook based on Clarkson World Shipyard Monitor
Tanker deliveries, removals, max phase-outPanamaxes 60,000 – 79,000 dwt m dwt 2009 2% reduction demand Fleet 401 28.5 m dwtOrderb. 80 5.9 “ 21% Not DH 58 3.9 ” 14% Assumed balanced market end 2008Deliveries and orderbook based on Clarkson World Shipyard Monitor
Tanker deliveries, removals, max phase-outAframaxes 80,000 – 119,999 dwt m dwt 2009 2% reduction demand Assumed balanced market end 2008Deliveries and orderbook based on Clarkson World Shipyard Monitor Fleet 851 89.0 m dwtOrderb. 160 17.7 “ 20% Not DH 74 7.1 ” 8%
Tanker deliveries, removals, max phase-outSuezmaxes 120,000 – 199,999 dwt m dwt 2009 2% reduction demand Fleet 390 59.6 m dwtOrderb. 138 21.5 “ 36% Not DH 36 5.1 ” 9% Assumed balanced market end 2008Deliveries and orderbook based on Clarkson World Shipyard Monitor
Tanker deliveries, removals, max phase-outVLCCs 200,000 dwt + m dwt 2009 2% reduction demand Assumed balanced market end 2008Deliveries and orderbook based on Clarkson World Shipyard Monitor Fleet 550 165.4 m dwtOrderb. 200 62.2 “ 38% Not DH 83 22.8 ” 14%
Tanker deliveries, removals, max phase-outAll tankers > 25,000 dwt m dwt 2009 2% reduction demand Assumed balanced market end 2008Deliveries and orderbook based on Clarkson World Shipyard Monitor Fleet 527 403.4 m dwtOrderb 228 121.8 “ 45% Not DH 626 50.2 ” 12%
Conversions • Some 34 m dwt SH tankers converted to dry, offshore and heavy lift, plus some 5 m dwt to double hull tankers m dwt There is a degree of uncertainty both regard to tonnage and in particular the timing of conversion
Development of single hull fleet (incl. DB/DS) m dwt Some 46 m SH tankers and 6 m DB/DS tankers
Tanker removals - phase out m dwt Year
Accumulated fleet increase based on deliveries, demolition, conversion and phase out m dwt Year
Investment in new tankers • Some $ 219 billion invested since 2000 with the result that 97% of tanker fleet double hulled end 2010* % *Assuming only DB/DS tankers continue to trade beyond 2010, some SH tanker will most probably continue until the age of 25 years old
Oil import DH tankers % number Source: Fearnleys
Oil export DH tankers % number Source: Fearnleys
SH trading beyond 2010? • Flag/Port States positions MARPOL 20 Trading until the age of 25 years • Australia No • China No • EU No • Mexico No • Romania No • S Korea No • Philippines No • UAE No no official note to IMO on • Bahamas Yes • Barbados Yes • Liberia Yes • Marshall Isl. Yes • Panama Flag Yes • Japan Yes • Singapore Yes • India Yes • Hong Kong * Yes *20 years • United States N/A OPA90
Tanker fleet development(Assumed max phase out, orderbook March 2009, include chemical tankers) m dwt number Tanker fleet increase 2003-2012: 70%
Need for new contractsassuming 4% increase in demand m dwt • Assumptions: • All SH out by 2010 (questionable) • Balanced market end 2008 (some slack existed) • Current orderbook • 24 years life time DH tankers as from 2014/all older cleared by 2013 • Ordering 1999-2008 ranged between 11 and 80 m dwt per year (50 m dwt in 2008)
Conclusion • A tanker surplus is building up unless demand is strong • No need for additional tanker orders over the next of years