Download

1 / 50
560 likes | 693 Views
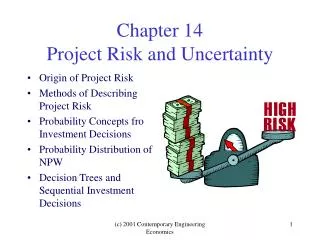
Learn the origins of project risk and methods for analyzing uncertainty in investment projects to make informed decisions. Consider various factors such as market share, costs, and tax rates to assess potential outcomes for effective risk management using sensitivity analysis. Dive into a case study of Boston Metal Company's transmission-housing project to understand how to address uncertainties and evaluate project viability.

E N D
Handling Project Uncertainty • Origin of Project Risk • Methods of Describing Project Risk
Origins of Project Risk • Risk is to describe investment project where cash flows are NOTKNOWN in advance with certainty. • Project risk refer to changeability in a project’s PW. We can see that risk is the potential for loss. • Risk Analysis is the assignment of probabilities to the various outcomes of an investment project.
When deciding whether or not to make a major capital investment, such as introducing a new product, a number of issues must be considered and estimated. The factors to be estimated include • the total market for the product; • the market share that the firm can achieve; • the growth in the market; • the cost of producing the product; • the selling price; • the life of a product; • the cost and the life of equipment needed; • the effective tax rates. • Many of these factors are subject to uncertainty.
The total market for the product • The market share that the firm can achieve
Methods of Describing Project Risk First, begin analyzing project risk by determining the uncertainty inbuilt in a project cash flows. We can do this analysis in a number of ways such as the following; 1. Sensitivity Analysis (SA) is a technique of investment analysis whereby different values of certain key variables are tested to see how sensitive investment results are to possible change in assumptions. SA sometimes called “What if analysis” because it answers questions such as, • If incremental sales are only 1,000 units, rather than 2,000 units?What will be the NPW be?
Sensitivity Analysis begins with a base case situation, which is developed using most-likely values for each input. • We then change the specific variable of interest by several specified percentages above and below the most likely value, while holding other variables constant. • Next, we calculate a new NPW for each of these values. • A useful way to present results of sensitivity analysis is to plot sensitivity graphs.
Case # 1 Example of Sensitivity Analysis • Boston Metal company (BMC), a small manufacturer of fabricated metal parts, must decide whether to enter competition to become the supplier of transmission housings (mechanism transferring power to wheels) for Gulf Electric Company that produces the housings in its own in-house manufacturing facility, but that has almost reached its maximum production capacity. • Therefore, Gulf is looking for an outside supplier. To enter competition, BMC must design a new fixture (tool) for the production process and purchase a new furnace. The available details for this purchase are as follows: • The new furnace would cost $125,000.
If BMC win the competition gets the order, it may be able to sell as many as 2,000 units per year to Gulf Electric for $50 each. In the case of variable cost, such as direct labor and direct material cost, will be $15 per unit. Fixed cost will amount to $10,000 per year. • The firm expects that the proposed transmission housing project will be about five year. The firm also estimates that the amount ordered by Gulf Electric in the first year will be ordered in each of the following four years. • The initial investment can be depreciated on a MACRS basis over a seven year period, and the marginal income tax rate is expected to remain at 40%. At the end of five years, the furnace is expected to keep a market value of about 32% of the original investment.
What Makes BMC Managers Worry: BMC’s managers are uncomfortable about this project, because too many uncertain elements have not been considered in the analysis: • If it decided to take project, BMC would have to invest in the furnace to provide Gulf electric with some samples as a part of the bidding process. • If Gulf Electric were not like BMC’s sample, BMC would continue to lose its entire investment in the furnace. • If Gulf were like BMC’s sample, then if it was overpriced, BMC would be under pressure to bring the price in line with competing firms. Even the possibility that BMC would get a smaller order must be considered, as Gulf may utilize its overtime capacity to produce some extra units. • Finally, BMC is not certain about its projections of variable and fixed costs. • Recognizing these uncertainties, the managers want to assess the various possible future outcomes before making a final decision. • Put yourself in BMC’s management position, and describe how you may solve the uncertainty associated with the project.
Case # 1 Example Sensitivity Analysis summary • Transmission-Housing Project by Boston Metal Company • New investment = $125,000 • Number of units = 2,000 units • Unit Price = $50 per unit • Unit variable cost = $15 per unit • Fixed cost = $10,000/Year • Project Life = 5 years • Salvage value = $40,000 • Income tax rate = 40% • MARR = 15% Determine the acceptability of the investment
Depreciation Calculation • The firm expects that the proposed project will have five year project life. • Cost Base = $125,000 and Recovery Period = 7-year MACRS 12
Cash Flow for BMC’s Transmission Housings Project “Base Case”
Gains (Losses) associated with Asset Disposal Salvage value =$40,000 Book Value (year 5) = Cost Base – Total Depreciation = $125,000 – $ 91,533 =$33,467 Taxable gains = Salvage Value – Book Value = $40,000 – $ 33,467 =$6,533 Gains taxes = (Taxable Gains) x (Tax Rate) = $6,533 x (0.40) =$2,613 14
Is this investment justifiable at a MARR of 15%? PW(15%) = -$125,000 + +$43,145(P/F, 15%, 1) + . . . +$75,619(P/F, 15%, 5) = $40,169 > 0 Accept the Project $75,619 $48,245 $44,745 $42,245 $43,145 0 1 2 3 4 5 Years $125,000 17
INPUT VALUE OF UNIT PRICE 20% LESS AND OTHERS ARE SAME INPUT VALUE OF PRICE 20% LESS AND OTHERS ARE SAME
Is this investment justifiable at a MARR of 15%? PW(15%) = -$125,000 + $31,145(P/F, 15%, 1) + $36,245(P/F, 15%, 2) +$32,745(P/F, 15%, 2) + $30,245(P/F, 15%, 4) + $63,619(P/F, 15%, 5) = – $57 No, Do not accept the Project $63,619 $36,245 $32,745 $30,245 $31,145 0 1 2 3 4 5 Years $125,000 19
Table - Sensitivity Analysis for Five Key Input Variables Base
EXERCISE INPUT VALUE OF DEMAND 20% LESS AND OTHERS ARE SAME INPUT VALUE OF DEMAND 20% LESS AND OTHERS ARE SAME
Is this investment justifiable at a MARR of 15%? PW(15%) = -$125,000 +$34,745(P/F, 15%, 1) +$39,845(P/F, 15%, 5) +$36,345(P/F, 15%, 5) +$33,845(P/F, 15%, 5) +$67,219(P/F, 15%, 5) = $12,010 > 0 accept the Project $67,219 $39,845 $36,345 $33,845 $34,745 0 1 2 3 4 5 Years $125,000 22
Table - Sensitivity Analysis for Five Key Input Variables Base
In this graph we can see that the project’s NPW is (1) very sensitive to changes in product demand and unit price, (2) fairly sensitive to changes in variable cost, and (3) relatively insensitive to changes in the fixed cost and salvage value. $100,000 90,000 Unit Price 80,000 70,000 Demand 60,000 50,000 Salvage value 40,000 Fixed cost Base 30,000 Variable cost 20,000 10,000 0 -10,000 -15% -10% -5% -20% 0% 5% 10% 15% 20% Sensitivity graph – BMC’s transmission - housings project
CASE # 2 Example 11.1 Sensitivity Analysis • Capstone Turbine Corporation is the world’s leading provider of micro-turbine based Micro-CHP (combined heat and power) systems for clean, continuous, distributed-generation electricity. The Micro-CHP unit is a compact turbine generator that delivers electricity on-site, or close to the point where it is needed. Designed to operate on a variety of gaseous and liquid fuels, this form of distributed-generation technology first introduced in 1998 for commercial use. • Capstone is considering marketing a modified, but downsized, version of the system unit for residential use, primarily for vacation properties in remote places. The project requires an initial investment of $55 million, but Capstone managers are nervous about this project, because too many uncertain elements have not been considered in the analysis. • Two primary factors that are difficult to estimate are the initial market size and how the market size will grow over the life of the project. The company has prepared the following financial data related to the project:
The initial investment can be depreciated on a seven-year MACRS, and the project is expected to have an economic service life of five years. The product life is relatively short, as the technology changes in the energy sector are changing rapidly. The firm’s marginal tax rate is 40%, and its MARR is known to be 15%. (a) Develop the cash flow series over the project life, based on the assumption of most-likely estimates. (b) Conduct a sensitivity analysis for each variable and develop a sensitivity graph.
CASE # 2 Example 11.1 continue............ Capstone Turbine Corporation • New investment = $55 million • Initial market size (units), year one = 1,500 units • Unit Price = $80,000 per unit • Unit variable cost = $60,000 per unit • Fixed cost = $8,000,000/Yr • Project Life = 5 years • Salvage value = $7,000,000 • Income tax rate = 40% • MARR = 15% • Develop the cash flow series over the project life based on the assumption of most-likely estimates. • Conduct a sensitivity analysis for each variable and develop a sensitivity graph.
Depreciation Calculation • The firm expects that the proposed project will have five year project life. • Cost Base = $55,000,000 and Recovery Period = 7-year MACRS 28
Gains (Losses) associated with Asset Disposal • Salvage value =$7,000,000 • Book Value (year 5) = Cost Base – Total Depreciation = $55,000,000 – $ 40,273,000 =$ 14,727,000 • Taxable gains (loss) = Salvage Value – Book Value = $7,000,000 – $ 14,727,000 =– $7,727,000 • Tax credits = [Taxable Gains (loss)](Tax Rate) = – $7,727,000 x (0.40) = -$3,091,000 29
Table 11.1 - Cash Flow for Capstone’s Micro-CHP Project Based on Most-Likely Estimates (Unit: $000; except demand)
Cash flow for Capstone’s MicroCHP Project Cash flow for Capstone’s Micro-CHP Project
Is this investment justifiable at a MARR of 15%? PW(15%) = -$55,000,000 + +$16,344,000(P/F, 15%, 1) + ……… . +$28,152,000(P/F, 15%, 5) = $11,107,000 > 0 Yes, Accept the Project $28,152 $19,388 $18,893 $18785 $16,344 0 1 2 3 4 5 Years $55,000 33
CASE # 2 SOLUTION (a) Sensitivity analysis: We begin the sensitivity analysis with a consideration of the base-case situation, which reflects the most-likely estimate (expected value) for each input variable. In developing table next slide, we changed a given variable by 20% in 5% increments above and below the base-case value and calculated new NPWs, while other variables were held constant. Now we ask a series of what-if questions: What if sales are 20% below the expected level? What if Operating costs rise? What if the unit price drops from $80,000 to $64,000 (20% drop)? Table, summarizes the results of our varying the values of the key input variables.
In this graph we can see that the project’s NPW is (1) very sensitive to changes in unit price and variable cost, (2) fairly sensitive to changes in demand, and (3) relatively insensitive to changes in the growth rate, fixed cost and salvage value.
Total depreciation: ……………………………………………………………………………………………… • Book Value: …………….……………………………………………………………………………………….. • Taxable gain or (Loss): ……………………………………………………………………………………….. • Gain Tax or (Tax credit): ……………………………………………………………………………………….. • NPW(15%) = ……………………………………………………………………………………………………
Total depreciation: …………………………………………………………………………………………………….. • Book Value: ………………………………………………………………………………………………………….. • Taxable gain or (Loss): ………………………………………………………………………………………………….. • Gain Tax or (Tax credit): ……………………………………………………………………………………………….. • NPW(15%) = …………………………………………………………………………………………………………
11.2 Lane Construction Lld. is considering the acquisition of a new dump truck. The truck's base price is $75,000, and it will cost another $15,000 to modify it for special use by the company. This truck falls into the MACRS five-year class. It will be sold after five years for $20.000. The truck purchase will have no effect on revenues, but it is expected to save the firm $35,000 per year in before-tax operating costs mainly in leasing expenses. The firm's marginal tax rate (federal plus stare) is 40%, and its MARR is 15%. (a) Is this project acceptable based on the most likely estimates given in the problem?
Cost basis = $75,000+$15,000=$90,000 • D1 = 20% * 90,000 = $18,000 • D2 = 32% * 90,000 = $28,800 • D3 = 19.2% * 90,000 = $17,280 • D4 = 11.52% * 90,000 = $10,368 • D5 = 5.76% * 90,000 = $5,184 • Dep.=18,000+28,800+17,280+10,368+5,184=$79,632 • Book value = 90,000 – 79,632 =10,368 1 2 3 4 5
11.2) (a) Project cash flows based on most-likely estimates:
Cost basis = $8,000,000 • D1 = 14.29% * 8,000,000 = $1,143,200 • D2 = 24.49% * 8,000,000 = $1,959,200 • D3 = 17.49% * 8,000,000 = $1,399,200